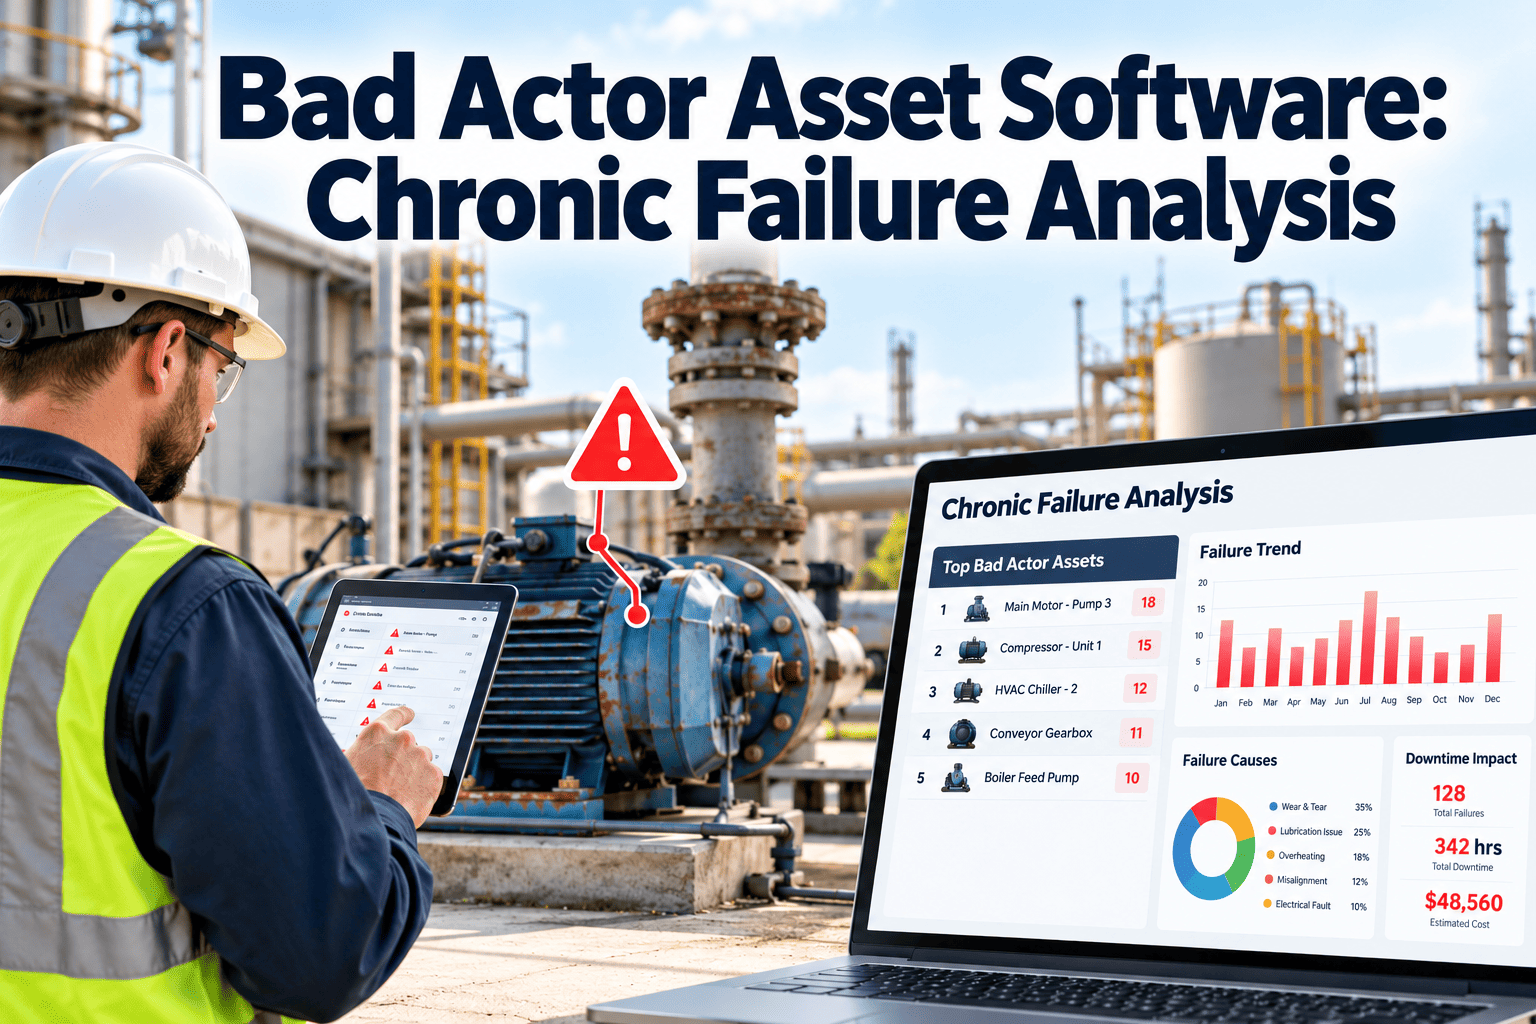
Every facility has a few assets that dominate the work order queue: the pump that seals every quarter, the air handler that trips on the same fault, the door controller nobody trusts. These bad actors consume labor, parts and goodwill while the rest of the plan slips. Finding them takes failure data that is coded, complete and comparable across assets. Chronic failure analysis then turns that data into a short, ranked list of problems worth solving, and Oxmaint maintenance management software can hold the work order history that analysis relies on.
Bad Actor Asset Software: Chronic Failure Analysis
Rank repeat-failure assets by cost, downtime and consequence, then decide whether to fix, redesign, monitor or replace
What Makes an Asset a Bad Actor
A bad actor is an asset whose failures cost far more than its share of the portfolio would suggest. The cost may be repair spend, downtime, safety exposure or the attention it pulls from planned work.
- Repeat failureThe same failure mode returns within a short, defined period.
- High costLabor, parts and contractor spend place it near the top of the ranking.
- High consequenceFailure affects comfort, safety, production, compliance or service delivery.
- Low effectiveness of repairFixes hold for a short time, which means the cause was never removed.
Many maintenance teams observe that a small share of assets accounts for a large share of cost. The exact split differs by site, so measure yours rather than assuming a ratio.
Firefighting Compared With Chronic Failure Control
Repair-and-repeat cycle
- Each breakdown treated as a one-off event
- Failure cause recorded as "faulty" or "repaired"
- Technicians remember problem assets, managers do not see them
- Replacement requests argued from opinion
- Same fault returns after the next shift change
Chronic failure control
- Repeat events counted by asset and failure mode
- Coded cause on every corrective work order
- Ranked list reviewed on a fixed cadence
- Decisions backed by cost and downtime history
- Actions tracked until the failure stops returning
Why Bad Actors Stay Hidden
Chronic failures survive because the data does not make them visible. These are the most common causes.
| Hiding place | How it shows up | What fixes it |
|---|---|---|
| Free-text failure descriptions | Ten ways of writing the same fault, so counts are unreliable | A short, controlled list of failure modes and causes |
| Work done off the system | Quick fixes never reach the work order history | Make logging fast on mobile, and require it for any repair |
| Work attached to the wrong asset | Cost lands on a parent asset or a generic location | Clean asset hierarchy and tagged equipment |
| Missing downtime data | Cost looks small because impact is not recorded | Capture start and end time for outages |
| Contractor repairs | Visits are paid but not linked to the asset | Create work orders for every contractor call |
| Staff turnover | Knowledge of problem assets leaves with the person | Keep history, notes and photos on the asset record |
The Chronic Failure Analysis Cycle
- 1CaptureRecord every failure with asset, mode, cause, labor, parts and downtime.
- 2RankScore assets by repeat count, cost and consequence.
- 3InvestigateRun root cause analysis on the top few.
- 4ActFix, redesign, change the task, monitor or replace.
- 5VerifyCheck whether failures actually stop returning.
Find the Assets Driving Your Maintenance Cost
Record failures with consistent codes, so repeat problems can be counted and ranked.
Ranking Method: A Simple Bad Actor Scorecard
Use a transparent score so engineers, managers and finance can agree on the order. Adjust the weights to your priorities.
| Factor | Measure | Why it matters |
|---|---|---|
| Repeat failures | Number of corrective work orders with the same failure mode in the last 12 months | Shows whether repairs are holding |
| Corrective cost | Labor, parts and contractor cost in the period | Shows financial drain |
| Downtime | Hours out of service | Shows operational impact |
| Criticality | Rating from the asset register | Shows consequence of failure |
| Safety or compliance link | Any failure tied to a code, safety device or inspection | Raises priority regardless of cost |
| Mean time between failures | Operating time divided by number of failures | Shows how often the asset lets you down |
Rank by each factor separately first. An asset that appears near the top of several lists is the strongest candidate.
Failure Data Standards That Make Analysis Possible
Analysis quality depends on a small set of fields that every technician completes the same way.
Choosing the Right Analysis Tool
Pareto analysis
Ranks assets or failure modes by cost or count to select where to focus. This is the starting point.Five whys
Quick cause tracing for simple failures with a clear chain of events.Fishbone diagram
Groups possible causes by people, method, material, machine and environment for team discussion.Failure mode and effects analysis
Reviews how an asset can fail, with effects and controls, to design better tasks.Failure trend analysis
Reviews time between failures to see whether they are random, early-life or wear-related.
From Diagnosis to Decision: What to Do With a Bad Actor
Root cause analysis should end in one of five decisions, each with an owner and a date.
A Weekly and Monthly Review Rhythm
- WeeklyReview repeat failures from the past seven days and assign immediate checks.
- MonthlyUpdate the bad actor ranking and review open root cause actions.
- QuarterlyCheck whether completed actions reduced failures, cost and downtime.
- AnnuallyFeed results into PM updates, capital requests and budget planning.
Worked Example: Ranking Five Assets
The data below is invented to show the method. Each asset is ranked on three measures, and the ranks are added. A lower total means a stronger bad actor candidate.
| Asset | Repeat failures (12 months) | Corrective cost | Downtime hours | Rank total |
|---|---|---|---|---|
| Chilled water pump 2 | 9 (rank 1) | $11,800 (rank 2) | 46 (rank 1) | 4 |
| Air handler 7 | 6 (rank 2) | $14,200 (rank 1) | 30 (rank 2) | 5 |
| Dock door controller | 5 (rank 3) | $3,100 (rank 5) | 12 (rank 4) | 12 |
| Rooftop unit 4 | 3 (rank 4) | $8,900 (rank 3) | 18 (rank 3) | 10 |
| Sump pump | 2 (rank 5) | $4,700 (rank 4) | 8 (rank 5) | 14 |
The pump and air handler lead the list. Before acting, check criticality, because a low-ranked sump pump that protects a critical space may still deserve attention.
Root Cause Walkthrough: A Pump That Keeps Losing Its Seal
This illustration shows how chronic failure analysis moves from symptom to cause. The facts are hypothetical.
- SymptomMechanical seal leaks every few months and is replaced each time.
- Why 1Seal faces are scored and overheated.
- Why 2The pump runs dry for short periods at start-up.
- Why 3Suction valve is partly closed and air enters the line.
- CauseThe operating procedure and valve position were never documented after a system change.
- ActionCorrect the valve setup, update the start-up checklist and verify seal life afterward.
Linking Findings Back to Preventive Maintenance and Spares
Chronic failure work should change routine maintenance, or the same patterns will return in other assets.
Getting Technician Buy-In for Better Failure Data
Chronic failure analysis depends on people recording what they actually found. Make the data entry worth their time.
- Keep failure code lists short, plain and tested with the people who will use them.
- Let technicians log from a phone at the asset, using QR tags or search to find the equipment.
- Show technicians how their entries led to a fix, so they see the benefit.
- Ask the team to nominate bad actors, because they often know before the data does.
- Recognize teams who permanently remove a chronic problem.
- Audit records on a sample basis and give coaching, not blame.
Trends in Chronic Failure Management for 2026
KPIs for Chronic Failure Reduction
Condition Monitoring and IoT Inputs
Sensors do not replace failure records. They add earlier warning to assets already identified as problem units.
- Temperature or vibration readings on motors, pumps and fans with repeat bearing failures.
- Runtime and cycle counts on equipment that fails after heavy use.
- Pressure and flow readings where blockages or leaks recur.
- Electrical load or current on drives that trip repeatedly.
- Alert thresholds that create inspection or work orders linked to the asset.
Compliance and Audit Value
Chronic failures often point to compliance risk. Fire, life safety, electrical and environmental systems that fail repeatedly need documented investigation and closure.
- Inspection evidenceDated findings and corrective actions available for internal and external review.
- Standards alignmentRecords that support programs aligned with asset management standards such as ISO 55000 and site safety requirements.
- Corrective action trailEach root cause action linked to owner, due date and result.
- Repeat finding controlEvidence that repeat audit findings have been analyzed, not just repaired.
How Oxmaint Supports Bad Actor Analysis
Oxmaint helps maintenance teams capture and review the data behind chronic failure work. Relevant capabilities include:
- Asset management with full work history for each asset.
- Corrective work orders with labor, parts and notes.
- Root cause analysis workflows linked to the failed asset.
- Preventive maintenance updated after analysis changes tasks.
- Digital inspections and checklists with findings recorded in one place.
- Mobile workflows and QR asset tags for quick failure logging.
- Dashboards and reports for repeat failures and cost by asset.
Review failure code setup and ranking reports in a demo using your own asset types.
Bad Actor Program Checklist
- Failure modes and causes are defined as short pick lists.
- Every repair, including contractor visits, creates a work order.
- Assets have unique IDs and a sensible hierarchy.
- Downtime is recorded for critical equipment.
- A named owner runs the monthly bad actor review.
- Top-ranked assets have an open root cause action.
- Results are verified after the action, not assumed.
- Lessons update PM tasks and spare parts holding.
Common Mistakes in Chronic Failure Programs
- Ranking only by cost and missing safety or compliance-critical assets.
- Investigating too many assets at once, so none gets a real fix.
- Stopping at the failed part rather than asking why it failed.
- Closing actions without checking that failures actually decreased.
- Ignoring operator practices, installation quality and environment as causes.
- Letting the ranking go stale after the first analysis.
Frequently Asked Questions
How do I identify bad actor assets?
Rank assets by repeat failures, corrective cost, downtime and criticality using consistent work order data.
How many bad actors should we work on at once?
Start with a small number your team can finish, then repeat as results come in.
What data is essential?
Asset ID, failure mode, cause, labor, parts and downtime. Try Oxmaint to capture them.
When should a bad actor be replaced?
When repair cost, risk and efficiency loss outweigh replacement cost. Book a demo to see cost history reports.
How do we know the fix worked?
Track repeat failures, cost and downtime on the asset after the action over a full operating cycle.
Stop Repeating the Same Repairs on the Same Assets
Turn failure history into a ranked list, a root cause plan and a result you can verify.