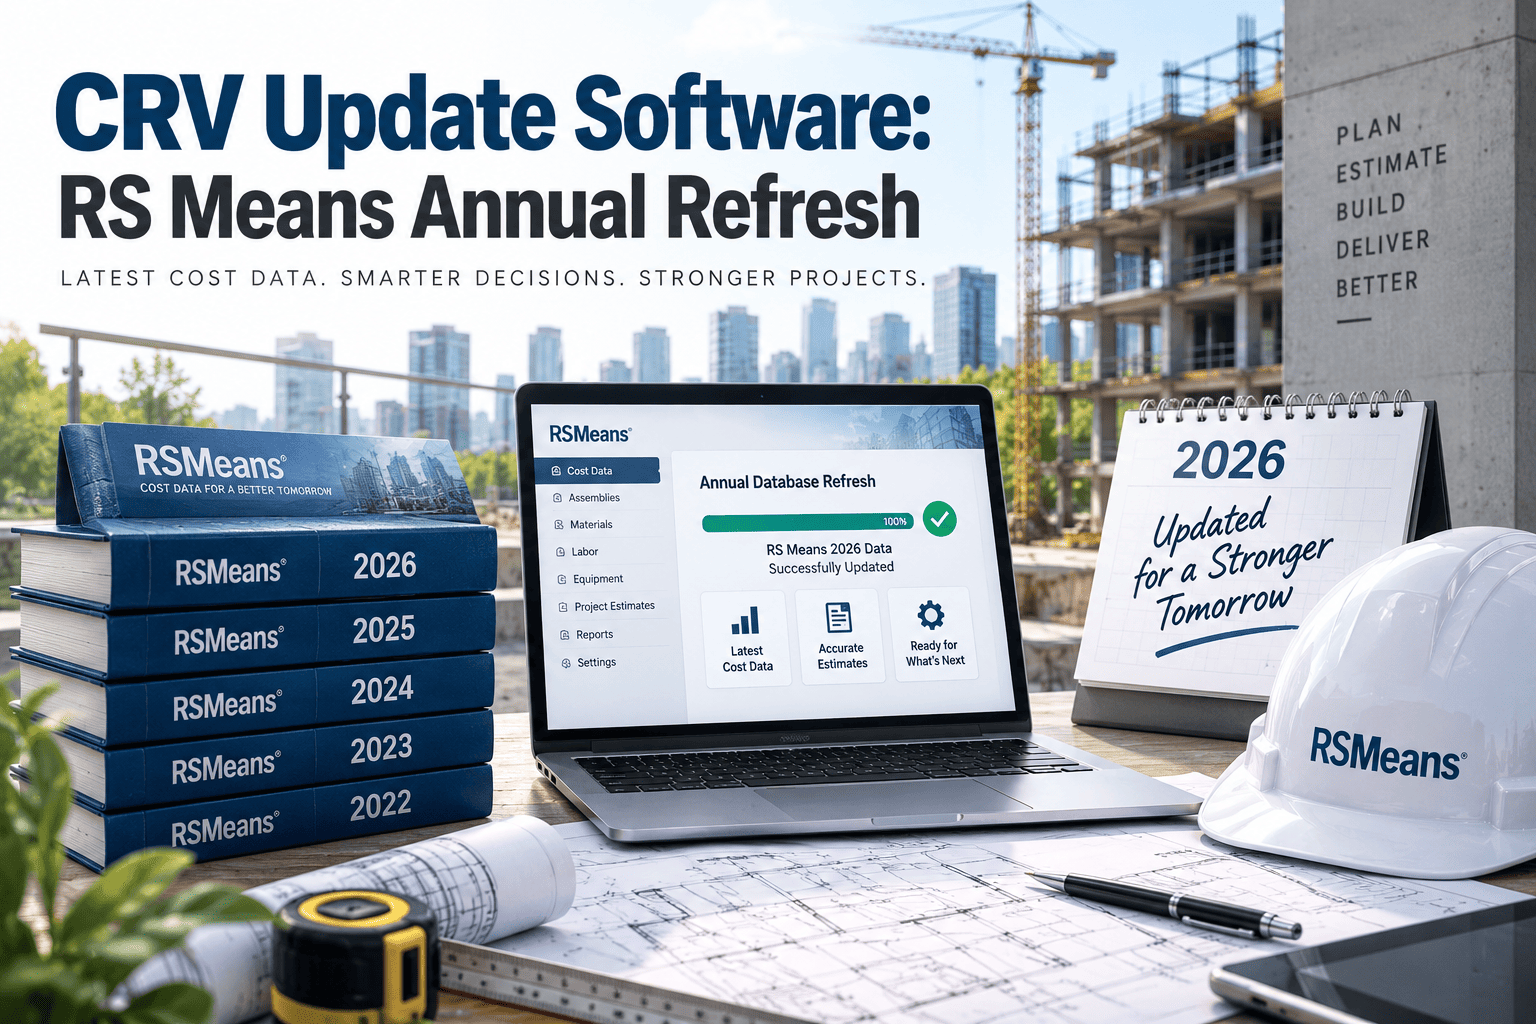
Every capital plan rests on one number that almost nobody double-checks often enough: current replacement value, or CRV, the estimated cost to rebuild a facility from the ground up today. If that number was set three or four years ago and never refreshed against real construction cost data, the Facility Condition Index calculated on top of it is quietly wrong, sometimes wrong enough to make a building look far healthier than it actually is. Construction costs do not sit still, and a CRV that was accurate in 2022 can be understated by twenty percent or more by the time steel, labor, and equipment prices catch up to it in 2026. This is not a hypothetical concern buried in an accounting footnote; it directly changes which buildings get flagged for capital investment and which ones get quietly deprioritized because their FCI looks acceptable on paper. CRV update software closes that gap by pulling current RS Means construction cost data straight into your facility records, so replacement values refresh automatically instead of waiting for the next full assessment cycle. That single habit is often the difference between a defensible Facility Condition Index and one a finance committee quietly stops trusting, which is exactly why platforms like OxMaint's CRV update software tie replacement value directly to live construction cost benchmarks.
CRV Update Software: RS Means Annual Refresh
How a yearly Current Replacement Value refresh, tied to real construction cost indices, keeps your Facility Condition Index accurate through every inflation cycle instead of drifting further off each year it's skipped.
Why a Stale CRV Quietly Breaks Your FCI
The Facility Condition Index formula looks simple on paper: total deficiency repair cost divided by current replacement value. The problem is that half of that fraction, the replacement value, is usually the part nobody revisits between full assessment cycles. Deficiencies get logged in real time as inspectors walk the building, but the CRV underneath them was often set years earlier and never adjusted for material, labor, or equipment cost inflation. It is an easy detail to overlook precisely because nothing about it feels urgent in the moment; the number was correct once, and inertia tends to do the rest. When construction costs rise faster than the CRV on record, the denominator in the FCI formula shrinks in relative terms, which mathematically inflates the FCI and makes a building look worse off than it is. When costs rise and the CRV is refreshed to match, the ratio stays honest. Either direction of error erodes trust in the number the moment a board member or auditor asks how it was calculated, and once a single number in a capital report gets questioned, people tend to start doubting the whole report rather than just the one figure. That is the quiet cost of a stale CRV: it is rarely the headline problem in a facilities meeting, but it undermines every other number sitting next to it.
How Fast CRV Drifts Without a Refresh
Construction cost inflation rarely moves in a straight line, but it almost never moves backward for long either. A replacement value that felt accurate the year it was set can fall meaningfully behind within a few refresh cycles, especially in years with material shortages or labor cost spikes. The pattern below illustrates why an annual refresh cadence, rather than a wait-and-see approach, keeps the gap small enough to correct rather than letting it compound into a number nobody trusts. It also illustrates why waiting for the next full assessment cycle to fix the problem is usually the wrong call, since a full reassessment might not happen again for several more years while the drift keeps widening in the background.
RS Means Integration: Manual vs Automated CRV Updates
RS Means construction cost data has long been the industry reference for unit pricing across building types, systems, and regions, but referencing it manually means someone has to look up the right cost line, apply the right location factor, and re-enter it into every affected building record by hand. That manual process tends to fall apart at scale; a portfolio of thirty buildings means thirty separate lookups, thirty chances for a typo, and thirty different moments where the update might simply get skipped because the analyst ran out of time before the deadline. CRV update software removes that manual translation step entirely, pulling the relevant unit costs directly into each facility's replacement value calculation the moment a refresh runs.
| Step | Manual CRV Process | Automated CRV Update Software |
|---|---|---|
| Cost Data Lookup | Analyst manually checks current RS Means unit costs | Live construction cost data linked to each building record |
| Location Adjustment | Regional cost factor applied by hand, often inconsistently | Location factors applied automatically per site |
| Update Frequency | Whenever someone remembers, often skipped for years | Scheduled annual or on-demand refresh |
| FCI Recalculation | Manual spreadsheet formula re-entry per building | FCI recalculates instantly across the whole portfolio |
| Audit Trail | No record of which index or year was used | Every refresh timestamped with the cost data version applied |
Why RS Means Specifically, and Not a Rough Estimate
Facilities teams sometimes fall back on a simple inflation multiplier to age a replacement value forward, applying a flat annual percentage bump instead of a real construction cost lookup. That shortcut works reasonably well in stable years but breaks down badly whenever material costs, labor markets, or equipment lead times move unevenly across systems and regions, which is most years. RS Means data is built specifically to reflect that unevenness, breaking construction costs down by building type, system, and location rather than treating every square foot the same way. A roof replacement in one region can cost meaningfully more or less than the same scope of work two states away, and a flat inflation multiplier has no way to capture that difference. Tying CRV update software to a recognized cost index also matters the moment a number gets questioned; being able to point to a specific, dated cost source is a very different conversation than explaining an internal estimate nobody can trace back to anything external.
Who Needs an Annual CRV Refresh Most
Any organization managing more than a handful of buildings benefits from a disciplined CRV refresh, but the need becomes sharper the more capital decisions ride on the resulting FCI. Public sector and municipal portfolios answer to taxpayers and grant auditors who expect replacement value figures to be traceable to a real cost source, not an internal guess carried forward from years earlier. Higher education systems often manage a wide mix of building ages and types on the same campus, which makes a flat inflation assumption particularly unreliable across the portfolio. Healthcare and senior living operators tend to carry higher-value, more specialized construction types where even a small percentage error in CRV translates into a large dollar swing in the calculated FCI. Corporate real estate teams managing dozens of leased or owned sites need a refresh process that scales without requiring a manual lookup for every single building each year, which is exactly the workload CRV update software is built to remove.
The Annual CRV Refresh Checklist
A refresh cycle works best when it follows the same short list of steps every single year, rather than being reinvented each time a new analyst inherits the task. Consistency matters here more than sophistication; a simple checklist followed every year without fail produces more trustworthy numbers than an elaborate process that only gets fully executed once every few cycles. The checklist below is what a disciplined annual CRV refresh typically covers inside a connected facility platform.





