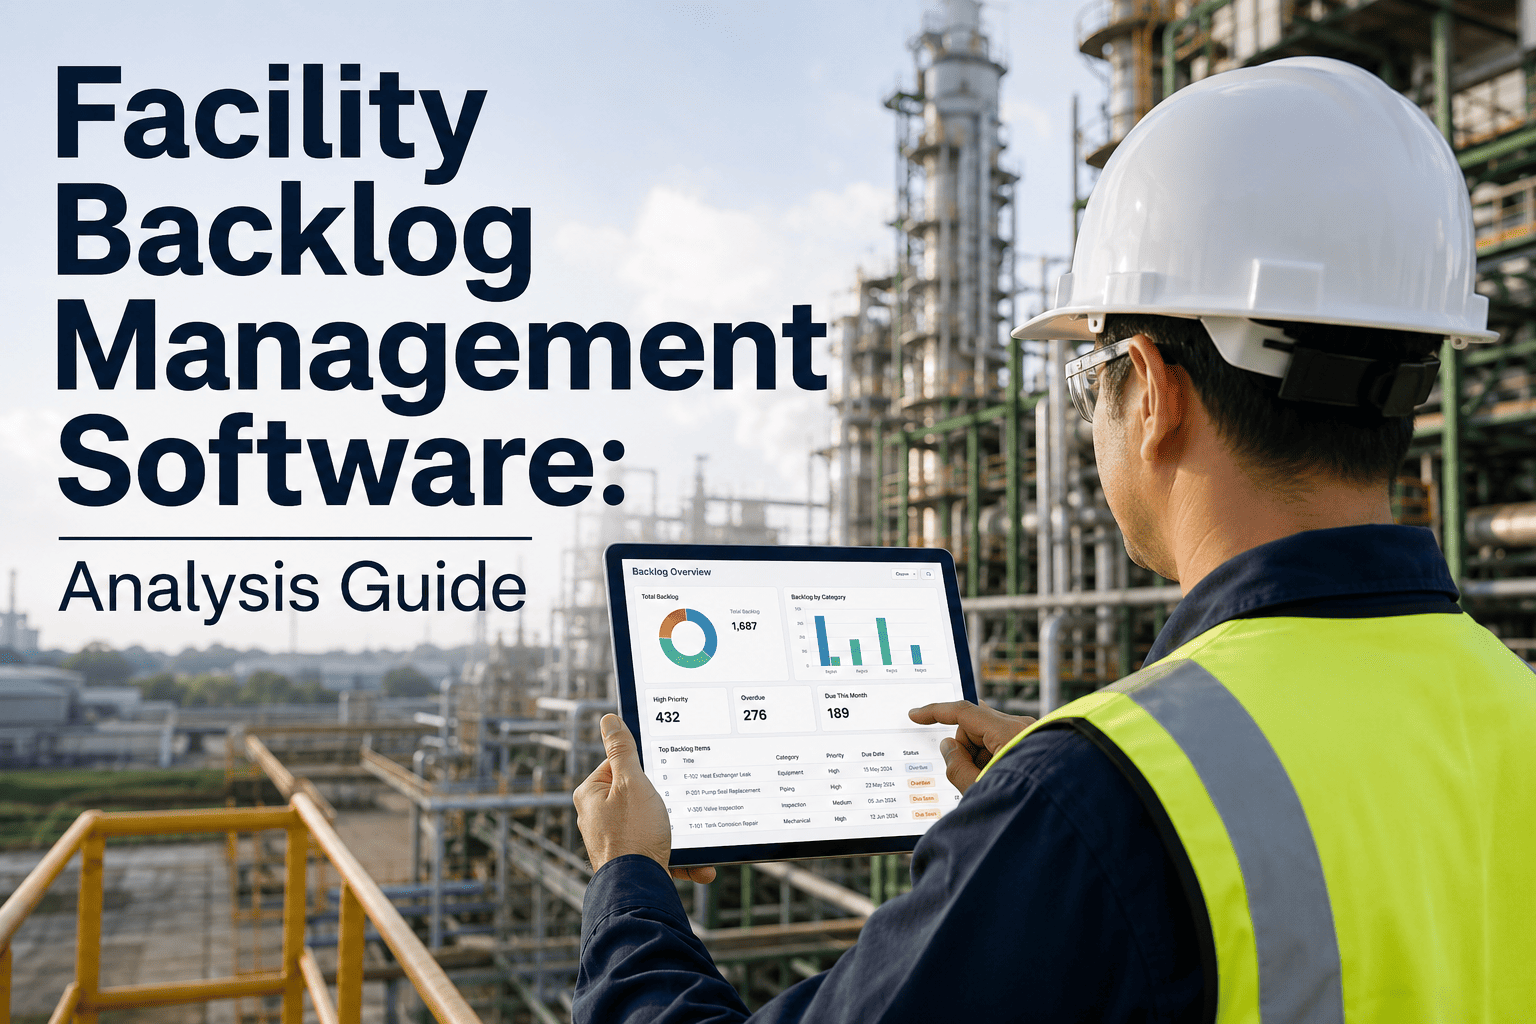
Most facility teams do not lose control of their maintenance backlog all at once — it happens one unlogged work order at a time, until a spreadsheet that looked manageable in January is quietly hiding six or nine weeks of deferred work by summer. The average industrial facility carries several weeks of backlog at any given moment, and a meaningful share of that queue contains at least one asset failure waiting to happen, invisible until something breaks. Backlog itself is not the problem — a planned queue of upcoming work is normal and healthy. The real risk is when nobody can see how old the queue is, which items are safety-critical, and which are cosmetic, so everything gets treated with the urgency of nothing. This guide breaks down what backlog aging actually looks like, how the right prioritization logic should score every open work order, and what to demand from software before you trust it with your queue. See how a live, AI-scored backlog dashboard works with OxMaint.
Facility Backlog Management Software: What Actually Separates the Good Platforms From the Spreadsheet Replacements
Backlog aging curves, safety-critical clearance rates, and the four-factor scoring logic that turns a chaotic work order queue into a ranked, executable list.
Why Backlogs Turn Invisible
Spreadsheet-based tracking fails quietly. A supervisor updates the file every week or two, triages by memory rather than data, and treats every open line item as roughly equal urgency. By the time a pattern would show up — a compressor with three open tickets, a valve overdue for the second cycle in a row — the file has already moved on. Teams tracking backlog this way commonly discover their most critical deferred work only after it fails, not before.
The Backlog Aging Curve
Every open work order belongs to an age bucket, and risk does not rise in a straight line — it accelerates the longer an item sits untouched. This is the shape a healthy backlog dashboard should show at a glance.
How Prioritization Should Actually Work
Manual triage asks one supervisor to weigh four variables in their head, for every open ticket, every week. Software should score them automatically and rank the queue so technicians work from the top down instead of the loudest complaint first.
Stop Triaging Your Backlog From Memory
A ranked queue built from four scored dimensions gives your team a top-down list instead of a guessing game — and gives leadership a live number instead of a quarterly surprise.
What to Look For in Backlog Management Software
| Capability | Spreadsheet Tracking | Basic CMMS | OxMaint |
|---|---|---|---|
| Live backlog age view | Manual, updated weekly at best | Partial, static reports | Real-time, always current |
| Automated priority scoring | Not available | Rule-based, manually configured | AI-scored across four factors |
| Capacity vs backlog forecasting | Not available | Rarely included | Built into the dashboard |
| Board-ready backlog reports | Manually compiled, hours of work | Basic export only | One-click, presentation-ready |
| Mobile technician access | Not available | Often desktop-first | Mobile-first, offline capable |
What Structured Backlog Management Delivers
Facilities that move from spreadsheet triage to a scored, CMMS-driven backlog consistently see the same pattern of results within the first 90 days.
Field Note
Our backlog was never actually out of control — we just could not see it. Once every open ticket had an age, a criticality score, and a cost-escalation estimate attached automatically, the queue basically prioritized itself. Technicians stopped debating what to work on next, and I stopped finding out about a compounding problem only after it became an emergency work order.
Frequently Asked Questions
Bring Your Entire Backlog Into One Ranked, Live Queue
Stop guessing which open work order matters most. OxMaint scores every ticket by criticality, safety impact, age, and cost escalation, then hands your team a queue they can simply work top to bottom.





