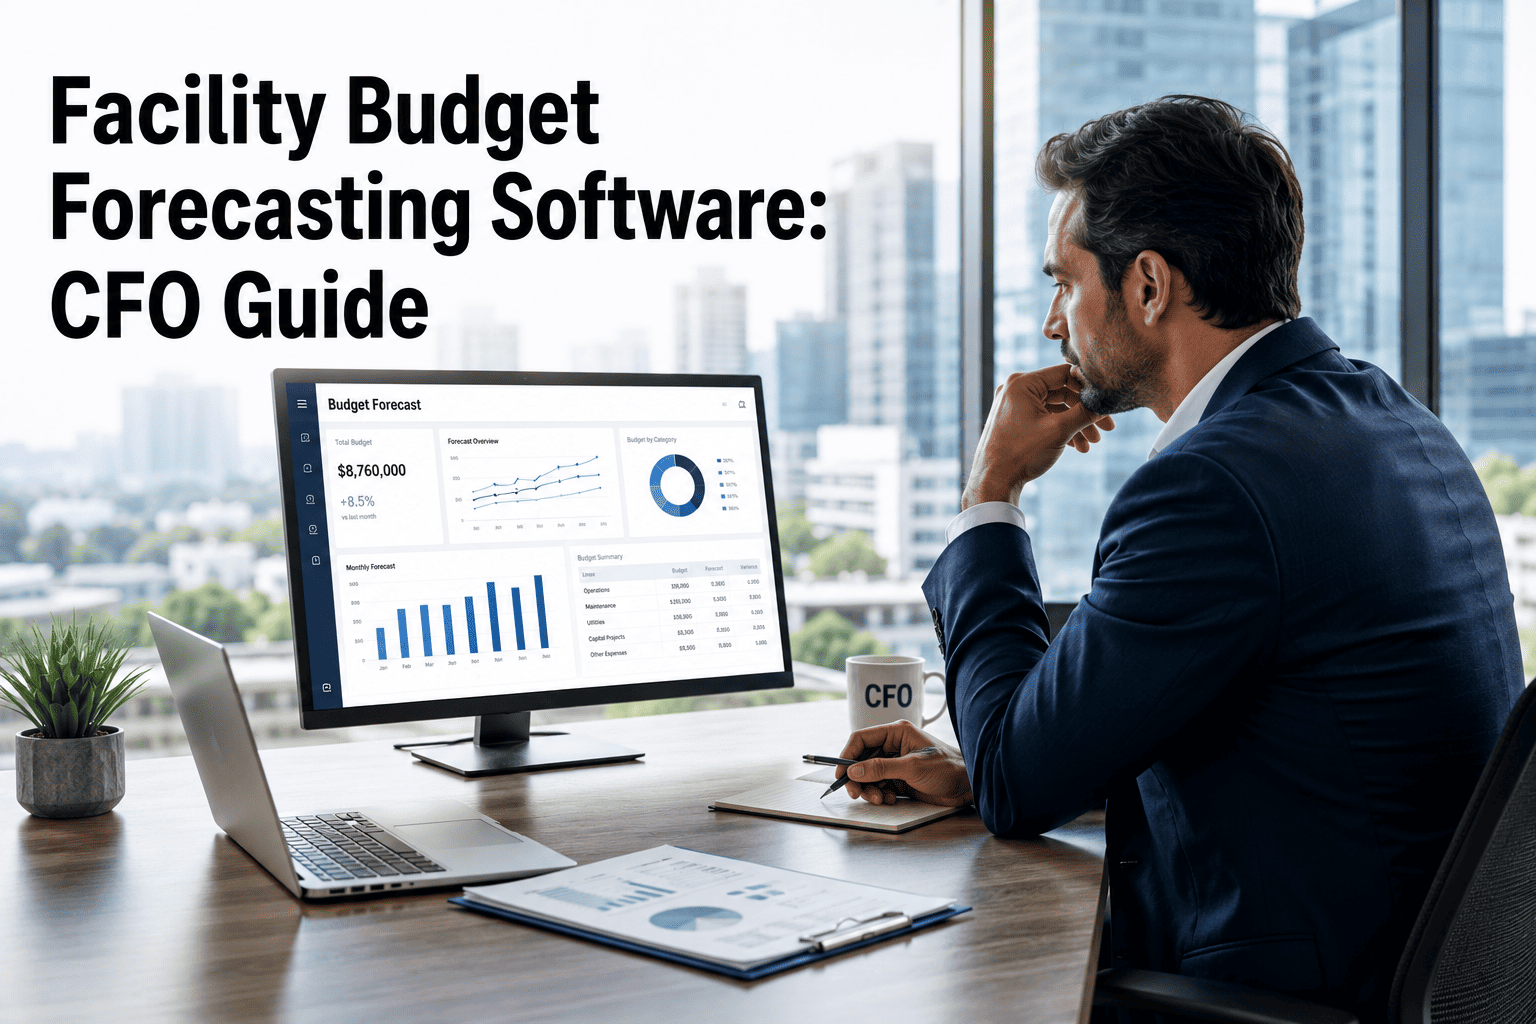
Every facility budget cycle starts the same way: take last year's number, add 5 to 10 percent for inflation, and hope the CFO doesn't ask where the figure came from. That guesswork approach is why facility teams without asset condition data face 40 to 65 percent CapEx budget variance year over year, while data-driven teams hold that variance under 15 percent. The gap isn't about forecasting talent — it's about whether the budget is built on spreadsheets and memory, or on real work order, asset condition, and failure-cost data. Facility budget forecasting software turns raw maintenance history into the CapEx and OpEx numbers a CFO can actually defend in a board meeting. This guide breaks down what that software needs to deliver, the real cost multipliers hiding inside deferred maintenance, and how to build a budget request finance approves on the first pass. Start a free trial to see how Oxmaint turns maintenance data into a CFO-ready forecast.
Budget Forecasting
CFO Reporting
2026 Guide
CapEx Forecast Accuracy: Guesswork vs. Data-Driven
40–65%
Budget variance without asset condition data
Under 15%
Budget variance for teams forecasting from real data
Source pattern: facility teams reporting CapEx variance by forecasting method, 2026
The Core Problem
Why "Last Year Plus Inflation" Keeps Losing to the CFO
Spreadsheet Budgeting
Built from last year's total plus a flat markup
No visibility into which assets drive the spend
Deferred repairs sit off the books until they fail
Capital requests read as opinions, not evidence
Variance: 40–65% against actual year-end spend
vs
Data-Driven Forecasting
Built from work order, condition, and failure cost data
Every dollar traced to a specific asset and risk score
Deferred backlog tracked as a visible dollar liability
Capital requests presented as a modeled business case
Variance: under 15% against actual year-end spend
What To Look For
Six Things CFO-Ready Forecasting Software Has To Deliver
01
Asset Condition Data
Remaining useful life calculated per asset from inspection and failure history, not a fixed depreciation schedule assumed at purchase.
02
Deferred Maintenance Liability
A risk-scored backlog register that turns postponed work orders into a visible dollar exposure instead of a silent line item.
03
OpEx vs CapEx Classification
Automatic separation of operating spend from capital replacement spend, so both budgets are built on the correct data set.
04
Rolling CapEx Forecasting
Five to ten year replacement forecasts generated from condition scores, with an inflation escalator applied to every future year.
05
Reactive-to-Planned Ratio
A live ratio showing exactly how much of the budget is bleeding into emergency repairs instead of scheduled preventive work.
06
Portfolio-Level Reporting
Multi-site rollups that summarize spend, backlog, and forecast accuracy in a format a CFO can review in one sitting.
Stop Presenting Guesses. Start Presenting Forecasts.
Oxmaint pulls asset condition, work order cost, and failure history into one rolling CapEx and OpEx forecast — built to survive a CFO's first question, not just the first slide.
Where The Money Hides
The Deferred Maintenance Multiplier — Typical Cases
Implementation
Four Steps To A Budget Finance Approves On The First Pass
Step 1 — Weeks 1–4
Pull Cost And Condition History
Export 12 to 24 months of work order costs by asset. Layer in the last condition assessment for every major system.
Step 2 — Weeks 4–8
Classify And Score The Backlog
Split spend into OpEx and CapEx. Score every deferred item by failure risk and dollar exposure if it slips another year.
Step 3 — Weeks 8–12
Build The Rolling Forecast
Model a 5 to 10 year CapEx plan with a 5 to 7 percent annual escalator, sequenced to avoid cash-flow spikes.
Step 4 — Ongoing
Present, Defend, Track Variance
Bring asset-level cost data to the budget meeting. Track forecast-to-actual variance every quarter and refine the model.
Field Perspective
What Facility And Finance Leaders Say About Data-Driven Budgets
The conversation with finance changed completely once we could show a dollar risk score next to every deferred work order. A budget request stopped being a negotiation and started being a decision backed by evidence the CFO could check himself.
VP of Facilities Operations
Multi-Site Commercial Real Estate Portfolio
We used to add 8 percent to last year's number and hope. Now our five-year CapEx forecast is built from actual condition scores, and our year-end variance dropped from over 50 percent to under 12 percent in two budget cycles.
Director of Capital Planning
Healthcare Facilities Network — 14 Sites
Your Next Budget Meeting Doesn't Have To Be A Guess
See how a rolling CapEx and OpEx forecast, backed by real asset condition data, changes the way finance responds to your requests.
Frequently Asked Questions
Facility Budget Forecasting — Common Questions
How is forecasting software different from a spreadsheet budget?
A spreadsheet holds whatever number someone typed in. Forecasting software pulls live work order cost and condition data automatically, so the forecast updates as assets age instead of going stale the day it's submitted.
Start a free trial to compare it against your current spreadsheet.
How far out should a facility CapEx forecast go?
Most finance teams expect a rolling 5 to 10 year horizon, refreshed annually and fully reassessed every 3 to 5 years as conditions and replacement costs change. Shorter windows tend to miss major system replacements entirely.
What is the fastest way to get CFO buy-in on a budget request?
Show the dollar risk of not spending, not just the cost of spending. Pairing a deferred item's planned cost against its failure cost reframes the request as risk management.
Book a demo to see a live budget defense built in Oxmaint.
How much can facility teams realistically save with this approach?
Facility teams moving from reactive to data-driven, planned spending commonly report 20 to 30 percent lower total maintenance cost within the first year, largely by shrinking the reactive repair premium.
Does this approach work for a multi-site facility portfolio?
Yes — portfolio rollups aggregate asset condition and spend across every site into one view, which is where forecasting software earns back the most time compared to consolidating spreadsheets manually.
Start a free trial to see a portfolio view.
Build The Budget Your CFO Actually Approves
Oxmaint turns asset condition, work order history, and deferred maintenance risk into a rolling CapEx and OpEx forecast your finance team can trust on the first read.