The facility condition index is one of the most quoted numbers in capital planning and one of the least current. Most organizations calculate it from a facility condition assessment that was completed years ago, then carry the figure forward until the next survey. Meanwhile roofs age, boilers fail, and deferred work piles up unseen. This guide explains how FCI works, why static reports fall behind, and what to look for in facility condition index software that keeps the score tied to live asset data. You can start tracking asset condition in Oxmaint to see how that connection works.
Facility Condition Index Software: FCI Assessment From Live Asset Data
Calculate FCI per building from the work orders, inspections, and asset records your team already maintains, instead of waiting for the next survey cycle.
What the Facility Condition Index Actually Measures
FCI is a ratio. It compares the cost of work that is needed but not yet done against what it would cost to replace the building or system outright. A lower ratio means a healthier facility.
- The numerator is deferred maintenance and repair, including overdue renewals and known deficiencies.
- The denominator is current replacement value, which should be updated as construction costs change.
- The result can be calculated for a single system, one building, a campus, or an entire portfolio.
Reading the Score
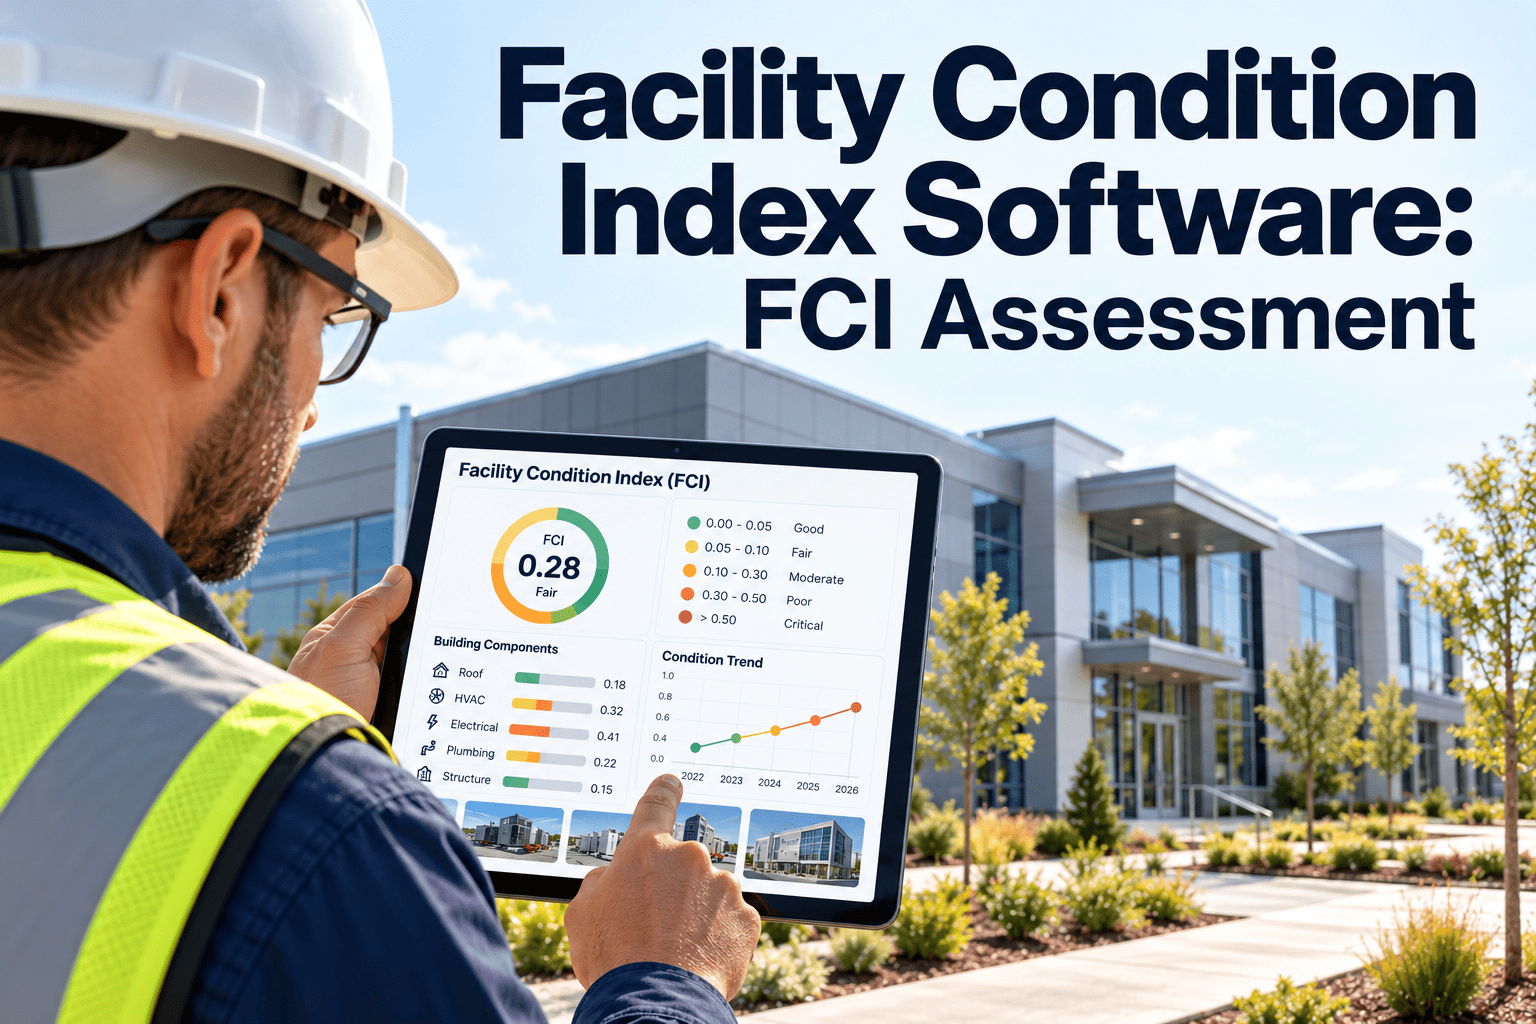
Rating bands differ between organizations, so confirm the thresholds your owner, district, or funding body uses. The scale below shows a commonly used pattern.
Why a Once-Per-Cycle Assessment Falls Behind
A facility condition assessment is valuable. It gives an independent view of building systems at a point in time. The problem is what happens after the report is delivered.
Live tracking supports an assessment. It does not replace professional surveys, which still validate condition, code issues, and cost estimates.
Keep Your Condition Data Current Between Surveys
Oxmaint links assets, inspections, and work orders so deferred maintenance stays visible by building and by system.
The Data Behind a Reliable FCI
Software cannot produce a trustworthy index from weak inputs. Five data sets carry most of the weight.
How Live FCI Calculation Works
The workflow is a loop. Each step feeds the next, and the score moves as the work does.
A Per-Building FCI Scorecard
A portfolio number hides the buildings that need attention. A scorecard by building and system shows where deferred cost is concentrated. The layout below is a template to fill with your own values.
| Building | Replacement Value | Deferred Maintenance | FCI | Largest Driver | Planning Response |
|---|---|---|---|---|---|
| Building A | Your value | Your value | Calculated | Roofing | Capital request |
| Building B | Your value | Your value | Calculated | HVAC | Phased renewal |
| Building C | Your value | Your value | Calculated | Electrical | Inspection and repair |
| Building D | Your value | Your value | Calculated | Envelope | Monitor, preventive work |
Why System-Level Scores Matter
A building with a moderate FCI can still hold one failing system that threatens operations. Break the score down by system so a single failing chiller or roof does not hide inside an acceptable average.
From FCI to Capital Decisions
The index informs choices, but it should not make them alone. Pair it with criticality, risk, and mission impact.
- Use work order trends to separate assets that are aging from assets that are failing early.
- Group related deficiencies into single projects to reduce mobilization cost.
- Show how funding scenarios change the projected FCI over several years.
Where FCI Programs Go Wrong
What to Look for in Facility Condition Index Software
Compare platforms against your own workflow rather than a feature list. These checks separate a reporting tool from a working system.
A Practical Rollout Timeline
KPIs to Track Alongside FCI
How Oxmaint Supports FCI Assessment Workflows
Oxmaint is a cloud-based CMMS built around asset records, inspections, and work orders, which are the inputs a live FCI depends on. Confirm configuration of FCI calculation fields during a demo for your organization.
Frequently Asked Questions
What is a good FCI score?
Lower is better. Many organizations treat under about 5% as good, but your owner may set different bands.
Can software replace a facility condition assessment?
No. It keeps data current between professional surveys. Book a demo to see the workflow.
How often should FCI be recalculated?
With live data it updates as work and inspections are logged, and leaders can review it quarterly.
Do we need replacement values for every building?
Yes, the ratio depends on them. Keep them current and documented.
Where should we start?
Pilot one campus or building class, then expand. Get started with your asset list.
Put a Current Condition Score Behind Every Capital Request
Connect assets, inspections, and work orders in Oxmaint so facility condition is measured as the work happens.