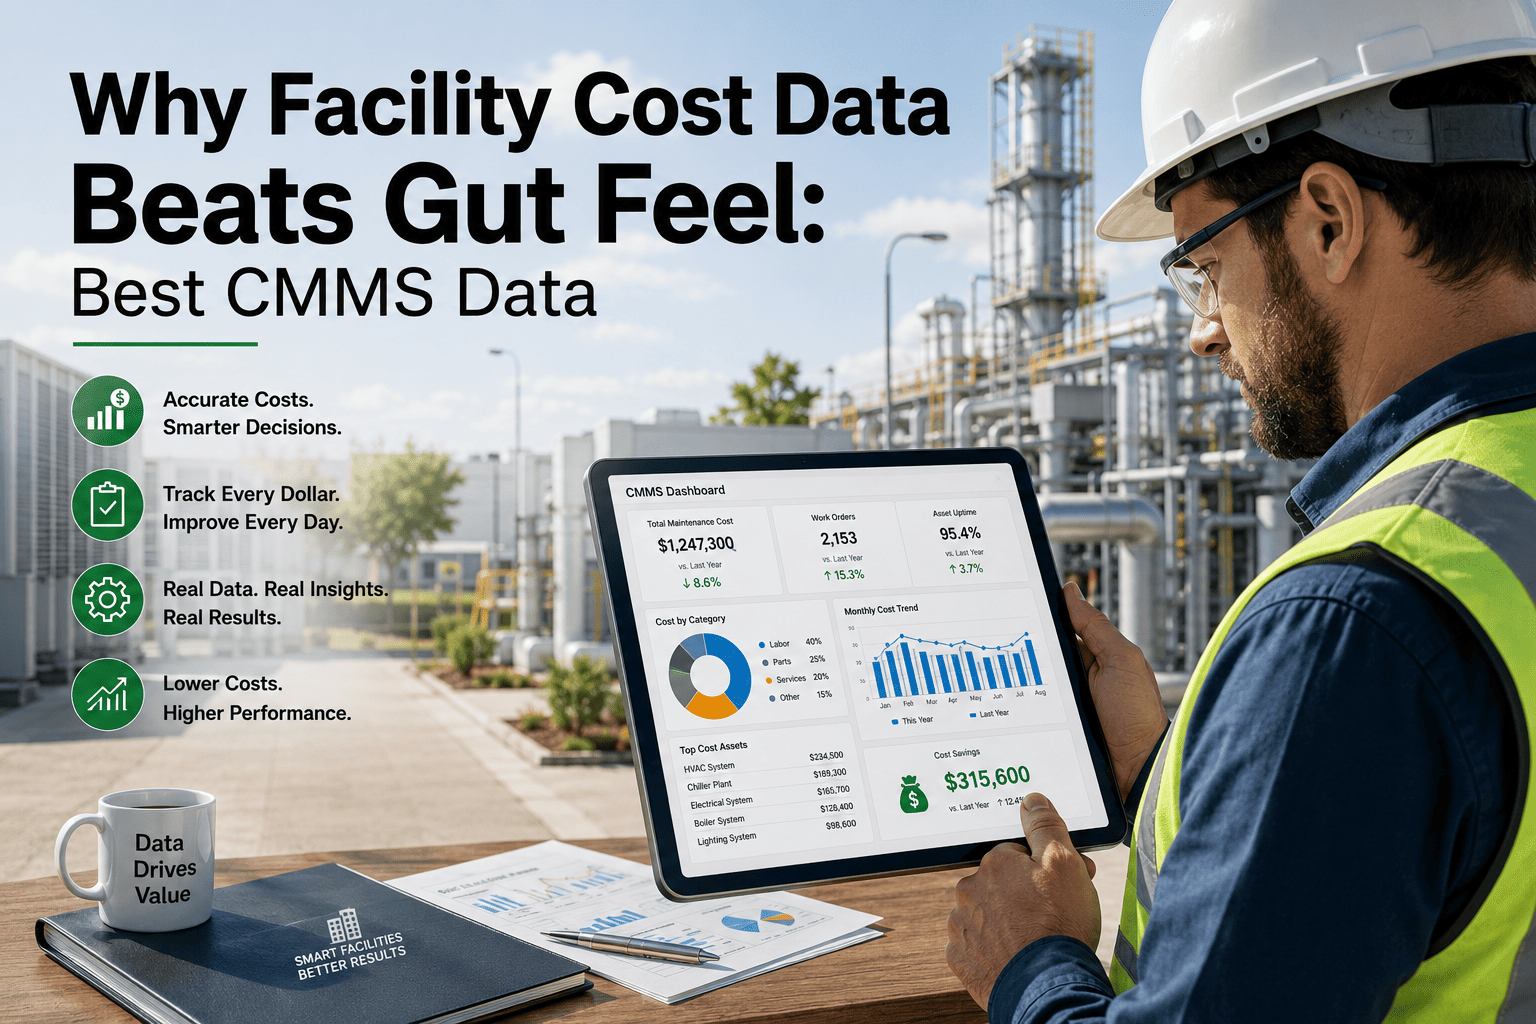
Facility cost data software replaces gut-feel budgeting with hard numbers — and in 2026, the best cost data CMMS platforms are the difference between a facilities director who defends every dollar and one who watches budgets get cut. Industry benchmarks show data-driven maintenance teams reduce operating costs by 15–30% while reactive, spreadsheet-based teams overspend by up to 40% on emergency repairs alone. This guide breaks down exactly why facility cost data beats intuition, which metrics matter most, and how a top cost data platform like OxMaint turns raw maintenance numbers into boardroom-ready business cases. Whether you manage a single site or a 40-building portfolio, the path from guessing to knowing starts with the right CMMS. Start Free Trial and see your real cost per asset within days, not quarters.
Your Gut Says the Budget Is Fine. Your Data Says Otherwise.
Facilities that track cost-per-asset, cost-per-work-order, and downtime-per-line outperform intuition-led teams on every financial metric. Here is the proof — and the platform that delivers it.
Why Gut-Feel Budgeting Fails Facility Directors in 2026
A 2025 industry survey found that 62% of facility budget requests without supporting data were either denied or reduced by 20% or more. Meanwhile, directors who presented cost-per-asset trends, downtime histories, and predictive failure forecasts saw approval rates above 85%. The gap is not about communication skills — it is about whether you walk into the room with a spreadsheet of guesses or a dashboard of facts.
- "The chiller feels like it needs replacing"
- Budget based on last year plus 5%
- No record of cost per asset or per failure
- Emergency repairs consume 30–40% of budget
- Board asks "why?" — no defensible answer
- "Chiller #3 has cost $18,400 in repairs over 14 months — replacement ROI is 2.1 years"
- Budget built from actual cost-per-asset trends
- Every work order, part, and labor hour tracked
- Planned maintenance absorbs 75%+ of spend
- Board sees dashboards, not opinions
5 Facility Cost Metrics the Best Cost Data CMMS Platforms Track Automatically
Not all metrics are created equal. These five are the ones CFOs and boards actually ask about — and the ones a top cost data platform like OxMaint captures without manual data entry.
Cost Per Asset Per Month
Total maintenance spend divided by active assets. Facilities tracking this metric identify their top 10% cost-drivers within 90 days — typically 15–20 assets consuming 40%+ of the budget.
Planned vs. Unplanned Ratio
World-class facilities target 80:20 planned-to-reactive. Most gut-feel operations run 30:70. Every point shift toward planned work saves an average of $3–$5 per dollar spent.
Mean Cost Per Work Order
Reactive work orders cost 3–5x more than preventive ones. A facility averaging $480 per reactive WO and $120 per preventive WO saves $360 every time a failure is prevented.
Downtime Cost Per Hour
For a mid-size manufacturing facility, one hour of unplanned downtime costs $10,000–$25,000 in lost production, expedited parts, and overtime labor. Data makes this visible before it happens.
Asset Remaining Useful Life
ISO 55000-aligned lifecycle tracking tells you when repair costs exceed replacement value. Without it, you are guessing at the single largest capital decision in your budget.
How a 180-Asset Facility Saved $127K in Year One With Cost Data
Consider a 180-asset commercial facility spending $42,000 per month on maintenance — roughly $504K annually. The facilities director relied on technician memory and a shared spreadsheet. Emergency callouts consumed 38% of the budget. After deploying OxMaint as their facility cost data software, here is what changed in 12 months:
| Metric | Before (Gut Feel) | After (OxMaint Data) | Impact |
|---|---|---|---|
| Emergency repair share | 38% of budget | 14% of budget | $121K redirected to planned work |
| Avg. cost per work order | $410 | $185 | 55% reduction via prevention |
| Budget approval rate | Denied 2 of 3 years | Approved with 12% increase | Data-backed justification |
| Asset replacement decisions | Based on age alone | Based on cost-vs-replacement ROI | Avoided $34K premature replacement |
| Audit preparation time | 3 weeks manual compile | 4 hours auto-generated | 95% time reduction |
Annual Savings = (Emergency Repair Reduction) + (Downtime Hours Avoided × Cost/Hour) + (Premature Replacement Avoided) − CMMS Subscription Cost
Example: $121K + (22 hrs × $12K) + $34K − $6K = $413K net savings on a $504K maintenance budget
Stop Defending Budgets With Opinions
See your real cost-per-asset, downtime trends, and ROI forecasts in a live 30-minute walkthrough tailored to your facility.
What Separates the Best Cost Data CMMS From a Digital Filing Cabinet
Dozens of platforms claim to track maintenance costs. Most are glorified work-order logs. The best cost data CMMS 2026 platforms share four capabilities that turn raw entries into strategic financial intelligence.
Automatic Cost Rollup Per Asset
Every labor hour, spare part, and contractor invoice auto-allocated to the specific asset. No manual tagging. No end-of-month reconciliation. Just open the asset record and see lifetime cost.
Preventive vs. Reactive Dashboards
Real-time ratio tracking with trend lines. When your planned percentage drops below 70%, you know before the budget does — not after the emergency invoices arrive.
Downtime Tracking With Cost Attribution
Log downtime events against specific assets and production lines. Attach your cost-per-hour figure and the platform calculates total downtime cost per month, per quarter, per asset.
Board-Ready Report Generation
One-click PDF and dashboard exports formatted for non-technical stakeholders. Cost trends, compliance status, and capital recommendations — no manual chart-building in PowerPoint.
How OxMaint Turns Facility Cost Data Into Budget-Winning Evidence
OxMaint is an AI-powered CMMS and EAM platform built for exactly this challenge — giving facility directors, reliability engineers, and multi-site operators the cost data infrastructure they need to replace gut feel with defensible numbers.
Reduce Unplanned Downtime
OxMaint’s preventive maintenance scheduling and IoT-triggered alerts catch failures before they happen. QR-tagged assets let any technician log issues in seconds from the mobile app — even offline on rooftops or in basements.
Cost Visibility Per Asset
Every work order, part, and labor hour auto-rolls up to the asset level. Open any equipment record and see lifetime maintenance cost, cost-per-month trend, and repair-vs-replace recommendation.
Audit-Ready in Hours, Not Weeks
Compliance reports, PM completion histories, and cost summaries generate in minutes. Whether it is ISO 55000, OSHA, or an internal audit, your documentation is always current and exportable.
From Spreadsheets to Live Data
Import your existing asset list, set up PM schedules, and start capturing cost data within days. No IT project, no consultants, no six-month implementation. Your team adopts it because it is genuinely easier than the spreadsheet.
The Budget Meeting That Changed Everything
"For three years I asked for a maintenance budget increase and got rejected. The first year I walked in with OxMaint dashboards — cost per asset, downtime trends, a repair-vs-replace analysis for our two worst chillers — the CFO approved a 15% increase and asked why I had not shown him this sooner. The data did the talking."
Facility Cost Data Software: 5 Questions Directors Actually Ask
What is facility cost data software?
Facility cost data software is a CMMS or EAM platform that automatically tracks, aggregates, and reports every maintenance cost — labor, parts, contractors, downtime — at the asset, building, and portfolio level. It replaces spreadsheets and guesswork with real-time dashboards that show exactly where every dollar goes.
How much does a data-driven CMMS save compared to gut-feel management?
Industry benchmarks show 15–30% reductions in total maintenance spend within the first year. The biggest savings come from shifting emergency repairs (which cost 3–5x more than planned work) to preventive maintenance. A facility spending $500K annually typically saves $75K–$150K. Book a Demo to see projected savings for your specific operation.
What metrics should a facility cost CMMS track?
At minimum: cost per asset per month, planned vs. unplanned work ratio, mean cost per work order, downtime cost per hour, and asset remaining useful life. The best cost data platforms also track PM compliance rate, spare parts turnover, and contractor spend per vendor.
How long does it take to switch from spreadsheets to a CMMS?
With OxMaint, most facilities are live within one week. Import your asset list via CSV, configure PM schedules using templates, and your team starts logging work orders from the mobile app on day one. No IT infrastructure or consultants required. Start Free Trial and import your first assets today.
Can a CMMS help me justify a capital replacement to the board?
Yes — this is one of the highest-value use cases. When you can show that Chiller #3 has consumed $18,400 in repairs over 14 months, that its downtime cost $47K in lost productivity, and that a $65K replacement pays back in 2.1 years, the board conversation shifts from "why do you need this?" to "why did we wait?"
Your Next Budget Meeting Could Go Very Differently
Join thousands of facility teams using OxMaint to track every dollar, prevent costly failures, and walk into budget reviews with data that gets approved.
Free 14-day trial · No credit card · Live in under a week





