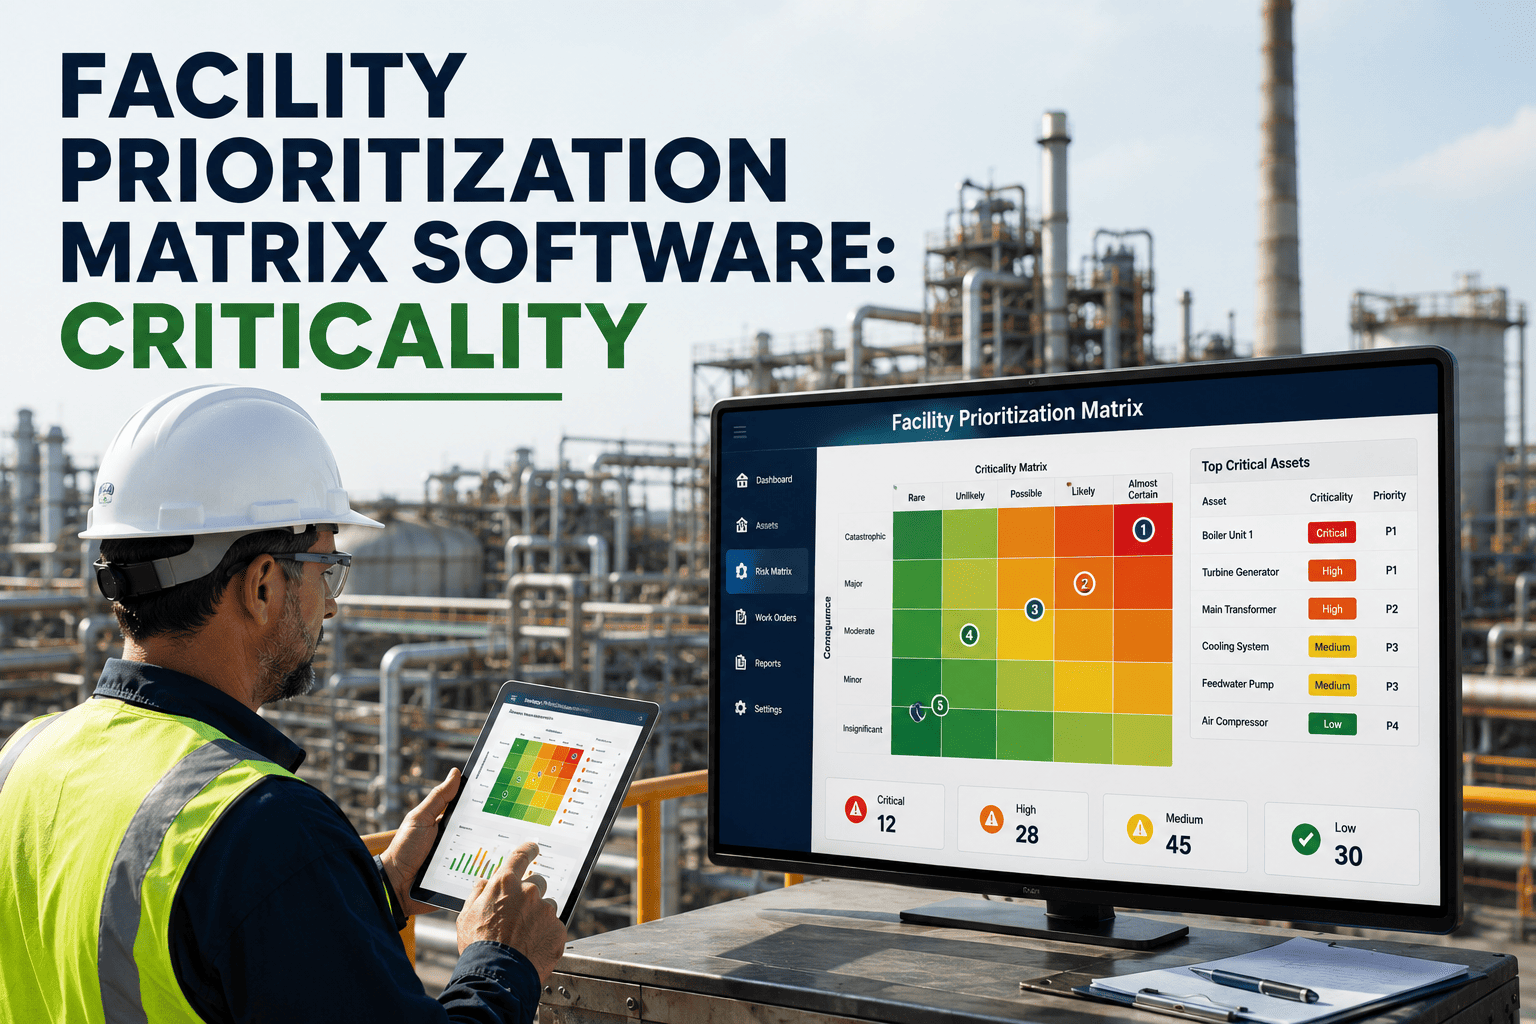
Every facility team eventually builds a Facility Condition Index score, and every capital committee eventually asks the same follow-up question: which items on this list should actually get funded first? FCI alone cannot answer that — a cracked parking lot with a high repair estimate can outrank a failing chiller that keeps a data center running, even though the chiller is the one that cannot wait. A facility prioritization matrix layers criticality on top of condition, so capital gets ranked by real operational risk instead of dollar amount alone. See how this works against your own asset data — book a prioritization matrix walkthrough.
5–7%/yr
Typical construction cost inflation that makes every year of deferral more expensive
3.2×
Cost multiple when a planned repair is deferred into an emergency replacement
10%
FCI threshold most benchmarks flag as a significant deferred maintenance backlog
40%
Reported reduction in operational risk when ranking is criticality-weighted, not cost-only
2 axes
Minimum inputs — condition and criticality — a defensible prioritization matrix needs
Capital Planning Standard
Capital committees, bond attorneys, and school boards increasingly ask for a documented, repeatable scoring methodology before releasing funds — not a list ranked by whichever repair estimate looks biggest. A criticality-weighted prioritization matrix gives finance and facilities the same defensible framework, so budget decisions hold up under audit and under public scrutiny.
FCI-Only Ranking vs. Criticality-Weighted Prioritization
FCI is a genuinely useful number — it just answers a narrower question than most capital committees think it does. It tells you how bad a building or system is, in dollar terms. It does not tell you what happens operationally if that item fails, or whether a backup system exists to absorb the failure. That second layer is what a criticality matrix adds.
FCI-Only Ranking
Sorted by deferred repair cost alone
IncludedOverall building-level condition comparison across a portfolio
IncludedSimple ranking by dollar value of deferred repair
IncludedUseful starting point for a first-pass capital list
GapCan rank a cosmetic repair above a mission-critical failure
GapNo adjustment for safety or life-safety risk
GapNo flag for single points of failure or missing redundancy
GapNo visibility into which items get costlier every year they wait
A parking lot repair and a clean-room chiller failure can post the same ranking despite completely different operational risk
Criticality-Weighted Matrix
Condition + operational criticality, combined
IncludedEverything FCI-only ranking does, plus operational context
IncludedCondition score combined with mission and operational criticality
IncludedSafety and life-safety weighting applied automatically
IncludedRedundancy and single-point-of-failure assets flagged separately
IncludedCost-of-deferral escalation factored into urgency, not just cost
IncludedBoard-ready ranked backlog register instead of a raw defect list
Capital gets directed to the assets whose failure actually stops operations — not just the ones with the biggest repair estimate
The Two-Axis Criticality Matrix, Visualized
A criticality matrix plots every deferred item on two axes at once: how bad its condition or failure risk is, and how much the organization depends on it operationally. The quadrant an item lands in — not its dollar value — determines its priority tier.
Condition / Failure Risk
Priority 1 — Immediate
High failure risk, high operational criticality. Example: a failing chiller supporting a data center or clean room.
Priority 2 — Monitor Closely
Low failure risk today, high operational criticality. Example: a sound but aging backup generator with no second unit.
Priority 3 — Planned
High failure risk, low operational criticality. Example: a cracked parking lot or worn exterior paint.
Priority 4 — Routine
Low failure risk, low operational criticality. Example: a cosmetic item in a low-traffic storage room.
Operational / Mission Criticality
Turn Your Defect List Into a Ranked Capital Plan
OxMaint scores every open deficiency on condition and criticality automatically, so your backlog register is ready for the next capital review without a spreadsheet exercise.
Five Inputs Behind an Accurate Criticality Score
A criticality matrix is only as good as the inputs feeding it. These are the five scoring dimensions a defensible prioritization framework should combine before a single item gets ranked.
Priority Tiers Once the Matrix Score Is Set
Once condition and criticality are combined, every item in the backlog lands in one of four action tiers — the same tiers a capital committee expects to see summarized on the first page of a funding request.
Prioritized Backlog Action Tiers
P1 — Immediate
High risk, high criticality, or a life-safety flag. Fund and mobilize within the current budget cycle.
Capital Committee + Ops Lead
P2 — Urgent
High criticality with a single point of failure. Fund within the next one to two budget cycles.
Facilities Director
P3 — Planned
Deteriorating condition, lower operational criticality. Schedule into the multi-year capital plan.
Facility Manager
P4 — Routine
Low risk, low criticality. Address through standard preventive maintenance cycles.
Maintenance Team
FCI Benchmark Reference by Condition Band
Most prioritization matrices still start from the widely cited FCI benchmark bands before criticality weighting is applied. This table is the quick reference facility and finance teams work from.
| FCI Range | Condition Band | Typical Signal | Recommended Action |
| Below 5% |
Good |
Minor, isolated deficiencies |
Maintain through standard PM cycles |
| 5% – 10% |
Fair |
Backlog accumulating, tipping point |
Selective capital intervention |
| 10% – 30% |
Poor |
Multiple systems near end of life |
Structured capital plan, criticality-ranked |
| Above 30% |
Critical |
Systems failing, safety risk rising |
Urgent appropriation or phased renewal |
Backlog KPIs Worth Tracking Once the Matrix Is Live
A prioritization matrix is not a one-time exercise — it is a living score that should move as work gets funded and completed. These are the KPIs that show whether the backlog is actually improving.
↓ Trend
Total Backlog Value
Dollar value of open deferred maintenance across the portfolio, tracked quarter over quarter
100%
Items With an Assigned Tier
Share of the backlog that has passed through the condition and criticality scoring model
< 1 cycle
P1 Resolution Time
Time from a Priority 1 flag to funding approval and work order mobilization
↓ Age
Average Deferral Age
Average time an open item has sat in the backlog since it was first identified
$ Avoided
Cost-of-Deferral Avoided
Estimated escalation cost prevented by funding an item before it moved to emergency status
↓ FCI
Portfolio FCI Trend
Whether the overall portfolio condition index is improving year over year after funding cycles
Frequently Asked Questions
Is a prioritization matrix different from just sorting by FCI?
Yes. FCI ranks by condition and dollar value alone. A prioritization matrix adds operational criticality, safety risk, and redundancy so the ranking reflects what actually happens if an asset fails, not just how expensive it looks.
Do we need a full facility condition assessment before we can use a matrix?
No — a matrix can run on your existing CMMS defect log and open work orders. A formal condition assessment improves accuracy over time, but you can start scoring against current data immediately.
How is criticality actually scored for each asset?
Criticality is typically scored per asset class against operational dependency, safety exposure, and redundancy, then combined with the condition score to produce a single priority tier — the same structure covered in the five scoring inputs above.
Can this framework support a bond referendum or board funding request?
Yes. A criticality-weighted, ranked backlog register is the exact document capital committees and bond attorneys ask for.
Book a walkthrough to see a sample register built from portfolio data.
Can I try this against my own backlog before rolling it out portfolio-wide?
Yes —
sign up free and run the scoring model against a single building or system before committing to a full portfolio rollout.
Stop Ranking Capital Requests by Guesswork
OxMaint combines condition, safety risk, operational criticality, and cost-of-deferral into one live prioritization matrix — so your next capital request is backed by data, not the loudest voice in the room.