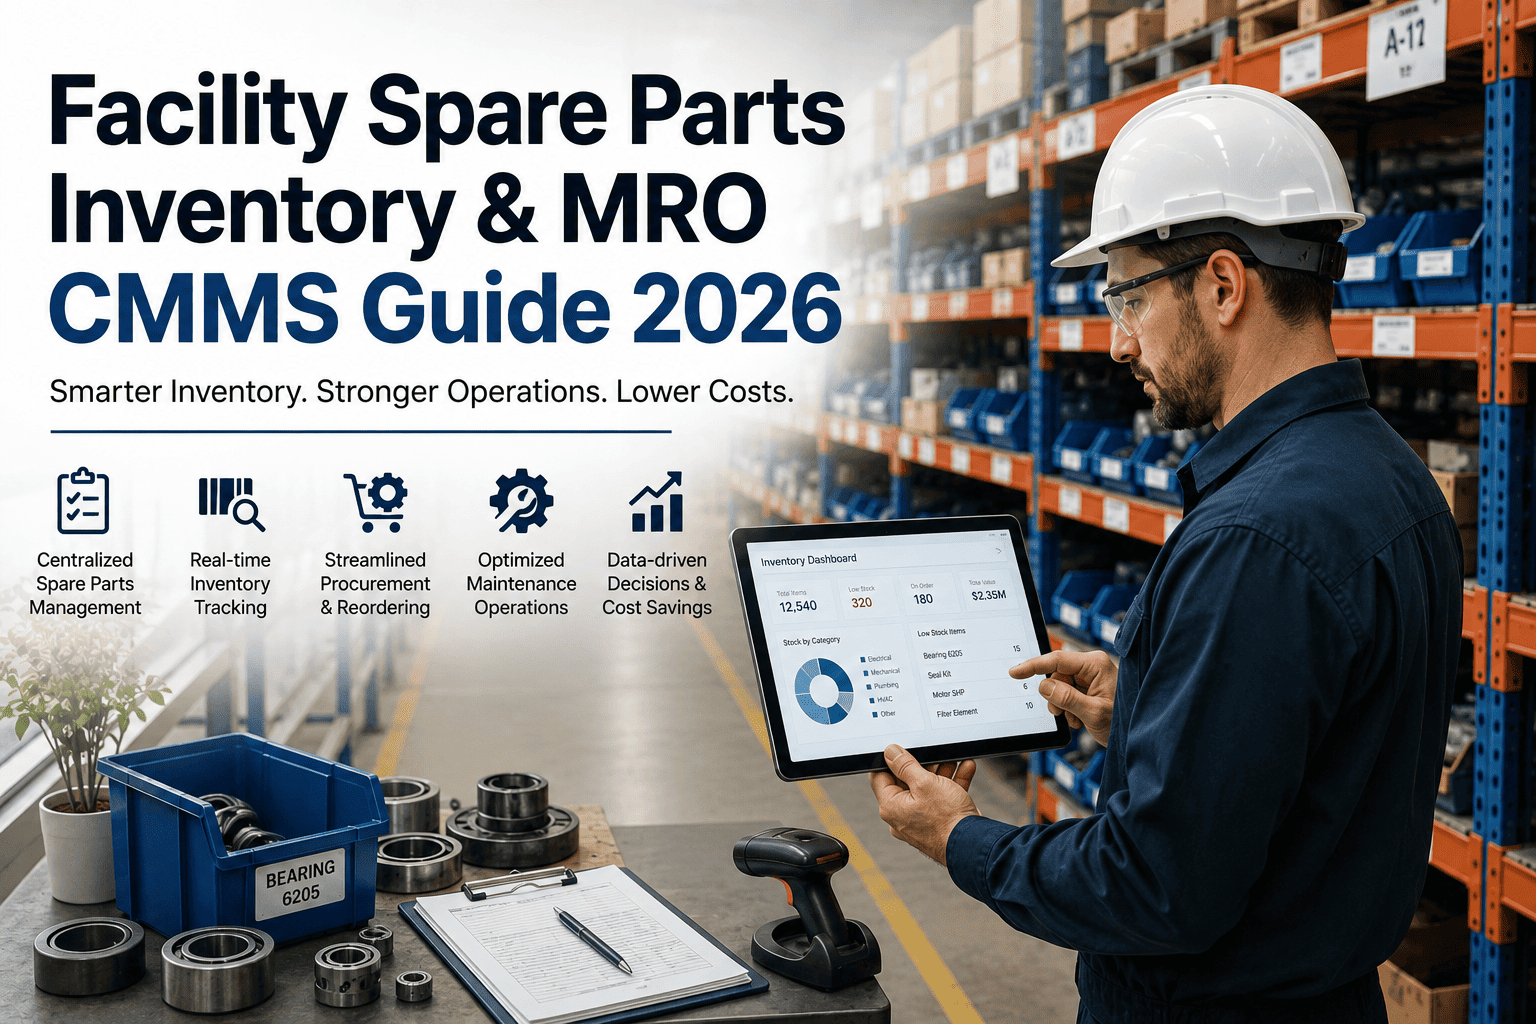
Spare parts inventory is the quiet line item that decides whether a maintenance program runs at 92% OEE or stalls on a Wednesday afternoon waiting for a $14 bearing. Industry studies from Plant Engineering and APQC consistently put MRO inventory at 20–40% overstocked while simultaneously missing the critical spares that cause 55% of unplanned downtime. This guide walks facility teams through ABC classification, critical-parts identification, reorder automation, and a CMMS-based MRO workflow built for ISO 55000 alignment. Whether you manage a 180-asset plant or a multi-site portfolio, the playbook below turns spares from a cost sink into an uptime engine—then shows you how to operationalize it in OxMaint. Start Free Trial to follow along with your own BOM.
Is your storeroom quietly costing you 55% of unplanned downtime?
Most facilities carry 20–40% too much MRO inventory yet still stock out of the 5–8% of parts that actually drive downtime. A CMMS-backed spares strategy flips that ratio—cutting carrying costs 15–30% while raising parts availability above 98% for critical assets.
Why spare parts management breaks first—and costs most
A 2024 Plant Engineering survey found that 55% of unplanned downtime traces back to parts unavailability or the wrong part being on hand. The same facilities report average MRO inventory turn rates of just 0.8–1.2 per year, meaning capital sits on shelves for 10–15 months before consumption.
Worked example: a 180-asset food-packaging plant
A Midwestern packaging facility spending $42,000/year on MRO carried $128,000 in on-hand spares with a 0.9 turn rate. After ABC classification and CMMS-driven reordering, they reduced on-hand value to $89,000, lifted critical-parts availability from 86% to 99.1%, and cut downtime-attributed labor by 22 hours per month—worth $31K in recovered OEE annually.
The 80/20 engine: classify parts, then tag what truly stops production
ABC analysis segments inventory by annual spend and usage frequency. Criticality analysis layers on consequence-of-failure. Together they tell you where to automate reorders, where to hold safety stock, and where to scrap the shelf.
High-value, high-impact spares
- Tight cycle counts (monthly), serialized tracking, vendor-managed inventory where possible.
- Auto-reorder at min; safety stock = 1.5× lead-time demand.
- Examples: servo motors, PLC cards, specialty bearings, hydraulic manifolds.
Moderate-value, regular-use parts
- Quarterly cycle counts; standard min/max reorder logic in CMMS.
- Safety stock = 1.0× lead-time demand.
- Examples: V-belts, contactors, filters, seals, common sensors.
Low-cost, high-volume consumables
- Annual counts; two-bin or vendor-consignment models.
- Reorder on visual trigger or consumption threshold.
- Examples: zip ties, lubricants, fasteners, tape, gloves.
Criticality override: ABC is not enough
A $9 proximity switch may be Class C by spend but Class A by criticality if it guards a conveyor interlock on a bottleneck line. Tag every part with a criticality score (1–4) tied to asset downtime cost, safety risk, and lead time. Any part scoring 1 or 2 gets Class A handling regardless of dollar value—safety stock, auto-reorder, and a named backup vendor.
Formulas that keep the right parts on the shelf—and capital off it
Reorder point and safety stock are the two math levers a CMMS pulls automatically. Set them per SKU using lead-time demand and service-level targets, then let the system trigger POs or vendor alerts without human chasing.
Reorder Point (ROP)
Example: a bearing consumed at 2.5 units/day with a 12-day supplier lead time and 8 units safety stock → ROP = (2.5 × 12) + 8 = 38 units. When on-hand drops to 38, the CMMS auto-issues a PO.
Safety Stock
Z = service-level factor (1.65 for 95%, 2.05 for 98%). σd = demand standard deviation. L = lead time. For a part with σd = 0.8, L = 12, target 98%: SS = 2.05 × 0.8 × 3.46 = 5.7 → 6 units.
Economic Order Quantity (EOQ)
D = annual demand, S = order cost (~$25–40/PO), H = holding cost per unit/year (~18–25% of item cost). EOQ minimizes the combined cost of ordering and carrying—use it to set max levels for Class A and B parts.
| Part Class | Service-Level Target | Safety Stock Multiplier | Count Frequency | Reorder Trigger |
|---|---|---|---|---|
| A — Critical/High-Value | 98–99.5% | 1.5× lead-time demand | Monthly | Auto-PO at ROP |
| B — Moderate-Value | 92–95% | 1.0× lead-time demand | Quarterly | Auto-PO at ROP |
| C — Low-Value/Consumable | 85–90% | 0.5× or two-bin visual | Annual | Visual / consumption threshold |
| Criticality 1–2 (any class) | 99%+ | 1.5× + backup vendor | Monthly | Auto-PO + alert to supervisor |
From work order to replenishment: the 5-step closed loop
A CMMS closes the gap between maintenance execution and inventory replenishment. When a technician issues a part against a work order, the system decrements stock, checks ROP, and—without a human in the loop—generates the next PO if needed. Here is the 90-day rollout most facilities follow.
Cleanse and consolidate the master parts list
Deduplicate SKUs, standardize naming (Manufacturer + Part Number + Description), purge obsolete items, and import the cleansed BOM into the CMMS. Most facilities reduce SKU count by 15–25% in this pass alone—recovering shelf space and cutting carrying cost immediately.
Run ABC + criticality analysis
Pull 12 months of usage data, rank by spend, assign A/B/C bands, then overlay criticality scores tied to asset downtime cost. Tag Class A and Criticality 1–2 parts for tight controls; flag Class C candidates for consignment or two-bin.
Set min/max, ROP, and safety stock per SKU
Load lead times, demand averages, and service-level targets into the CMMS. Configure auto-PO rules: at ROP, generate a draft PO for approval; for critical parts, auto-send to a pre-approved vendor and notify the maintenance manager.
Link parts to assets and work orders
Map each critical part to its parent asset in the CMMS BOM. When a work order closes, the issued part auto-decrements stock, updates asset cost history, and feeds MTBF/MTTR analytics. This linkage is what turns inventory data into reliability intelligence.
Tune reorder parameters and review KPIs
Review fill rate, stockout incidents, obsolete-stock value, and inventory turns. Adjust safety stock for parts with demand variability. Target: 98%+ critical-parts availability, 1.5+ inventory turns, and a 15–30% reduction in on-hand value within six months.
The five numbers that prove your spares program works
A CMMS dashboard should surface these KPIs weekly. If any drift outside target, the system flags the offending SKU and its parent asset—so you fix the root cause, not just the symptom.
Percentage of work orders where the needed critical part is on hand when the technician arrives. Below 95% signals understocking or bad ROP math.
How many times MRO stock is fully consumed and replaced per year. World-class is 2.0+; most facilities start at 0.8–1.2.
Share of on-hand value with zero issues in 12 months. Above 10% means capital is trapped on shelves earning zero return.
Time from work-order part request to physical issue. Long pick times point to poor bin labeling or misplaced stock.
Match between CMMS on-hand qty and physical count for cycle-counted SKUs. Below 97% indicates transaction discipline gaps.
The only acceptable target for Criticality 1–2 parts. Every stockout here is a downtime event with a known dollar cost.
After moving to OxMaint's CMMS, we cut on-hand MRO value by 31% in four months while pushing critical-parts availability from 87% to 99.2%. The auto-reorder rules alone saved our team 6 hours a week of PO chasing.
Stop paying for shelves of parts you never use—and start stocking the ones that stop downtime.
OxMaint's CMMS automates ABC classification, ROP calculations, and PO generation so your team spends time maintaining assets, not chasing parts.
Facility spare parts inventory: the questions that matter
How often should we cycle-count spare parts inventory?
Class A parts (top 20% of spend, plus all Criticality 1–2 items) should be counted monthly. Class B quarterly, Class C annually. A CMMS lets you schedule counts automatically and reconcile discrepancies against work-order issues—so a 180-asset facility can run a full cycle-count program with under 4 hours of technician time per week. Book a Demo to see the cycle-count scheduler in action.
What is the difference between MRO inventory and spare parts inventory?
Spare parts are replacement components tied to specific assets—bearings, motors, valves. MRO (Maintenance, Repair, and Operations) is the broader category that also includes consumables (lubricants, filters, fasteners), safety supplies, and tools. Most facility storerooms manage both under one MRO inventory program, and a CMMS tracks them with the same SKU, BOM, and reorder logic.
How much MRO inventory should a facility hold?
A common benchmark is 0.5–1.5% of asset replacement value held as on-hand MRO stock, with an inventory turn rate of 1.5–2.0 per year. If your turns are below 1.0, you are overstocked; if critical-parts fill rate is below 95%, you are understocked on the wrong items. The fix is almost always classification and reorder automation, not buying more.
Can a CMMS automatically reorder parts?
Yes. When on-hand quantity drops to the reorder point, the CMMS generates a draft purchase order for the approved vendor—critical parts can auto-send without approval, while high-value POs route to a manager. The system uses your lead-time and demand data to calculate safety stock, so reorders happen at the right time without manual monitoring. Start Free Trial to configure auto-reorder rules on your own BOM.
How do we handle parts with long lead times or single-source suppliers?
For parts with lead times over 21 days or single-source risk, raise safety stock to 2.0× lead-time demand, qualify a secondary vendor (even at higher cost), and tag the part as Criticality 1 or 2 in the CMMS. The system will then track vendor performance, alert you before a stockout, and let you benchmark alternative suppliers when lead times slip. This is standard practice under ISO 55000 and TPM spare-parts management.
Turn your storeroom into an uptime engine in 14 days
Import your parts list, run ABC classification, and automate reorders with OxMaint's CMMS. Most facilities see measurable inventory savings within the first billing cycle.
Free 14-day trial · No credit card