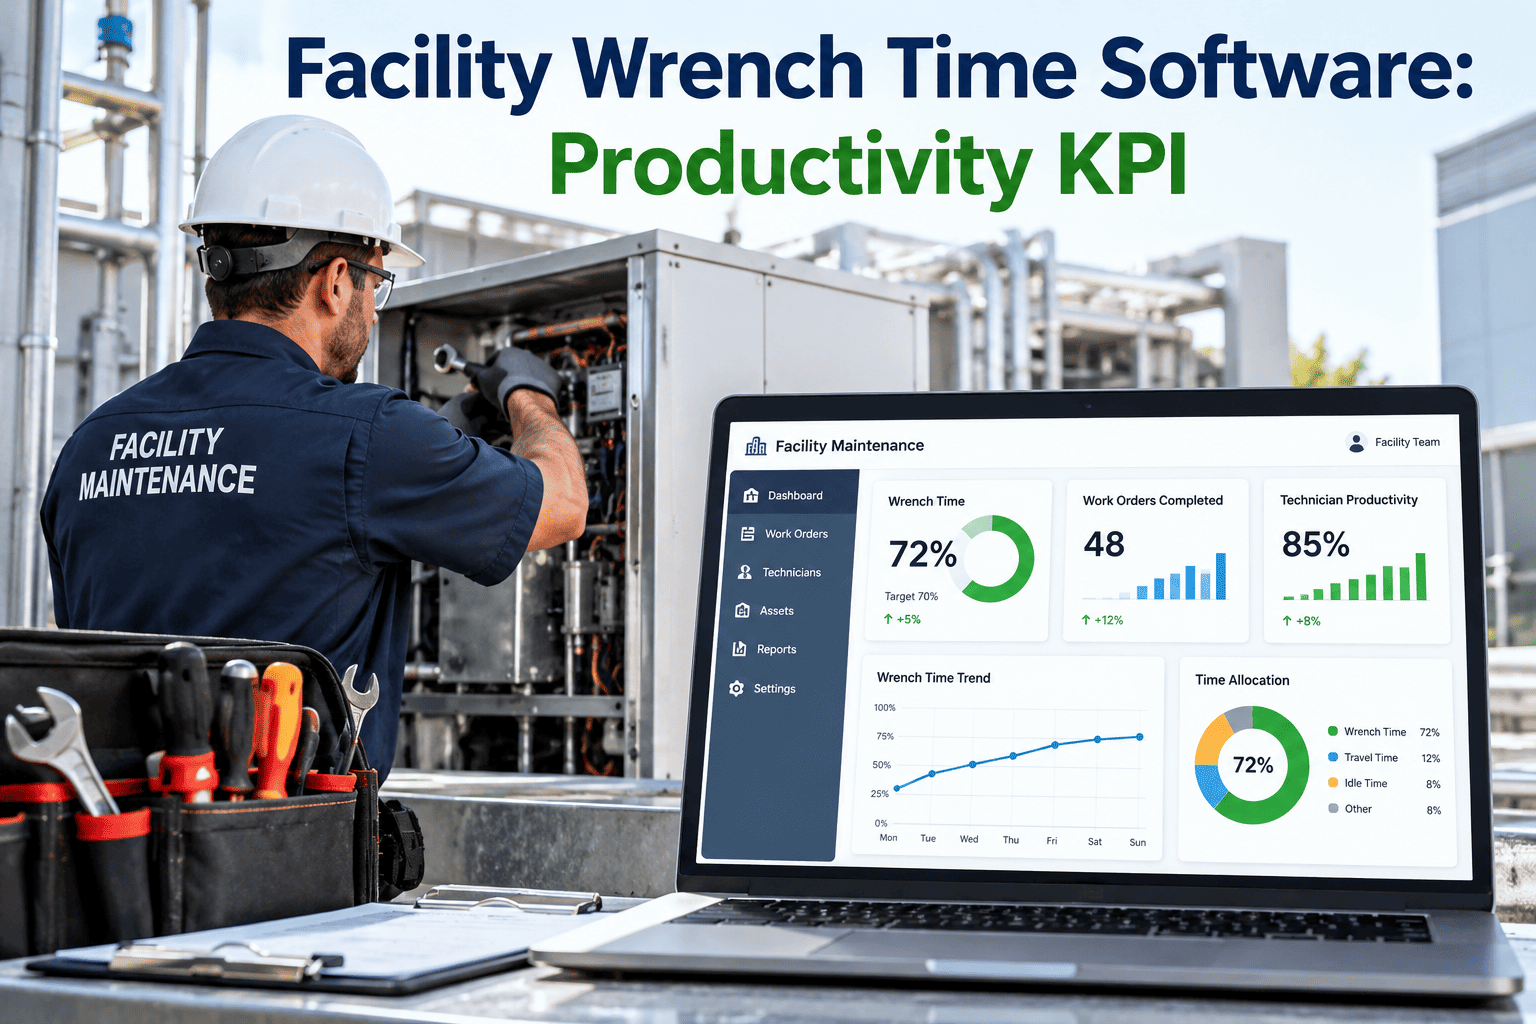
Ask a maintenance leader how many hours their technicians spend each week actually turning a wrench versus everything else, and the honest answer is usually a guess. Walking to the parts room, waiting on a lift, hunting for the right documentation, and traveling between work zones all eat into the day, yet none of it shows up as a line item anywhere. Wrench time is the single number that exposes exactly how much of a technician's paid hour is spent on the value-generating work they were actually hired to do. See your team's real wrench time with a free Oxmaint account, calculated automatically from the work already being logged.
What Wrench Time Actually Measures
Wrench time is the percentage of a technician's scheduled hours spent on hands-on repair or maintenance work, as opposed to travel, waiting, searching for parts, or administrative tasks. Industry studies have tracked this metric for decades, and the results are remarkably consistent across sectors: most maintenance teams operate well below the productivity level they assume they are hitting. The gap between assumed and actual wrench time is usually the single biggest surprise a maintenance leader encounters the first time they see real data instead of an estimate.
Where the Missing Hours Actually Go
Nobody sets out to waste a technician's day. The hours disappear in small, repeated increments that never look significant on their own but add up to nearly half of a shift by the time you total them across a week. Understanding exactly where the time goes is the first step toward recovering it, and it is almost always a facility-specific pattern rather than a universal one.
Why Facilities Rarely Measure This on Their Own
Calculating wrench time manually requires a time and motion study, where an observer physically follows technicians around a facility with a stopwatch for days or weeks. It is expensive, disruptive, and technicians almost always behave differently when they know they are being watched, which quietly skews the results toward a more favorable number than reality. That is precisely why most facilities have never actually measured their wrench time and instead rely on a rough guess passed down from whoever held the role before.
A software-based approach solves this by deriving the same insight from data technicians are already generating anyway. Every time a work order is opened, paused, or closed, and every time a mobile app records a location change, a maintenance platform can reconstruct where the hours actually went without anyone needing to carry a clipboard or feel watched. The result is a number that reflects a normal week, not a week distorted by observation.
What Wrench Time Reveals That Other Metrics Miss
Total maintenance hours logged and total work orders completed are both useful numbers, but neither one tells you whether those hours were spent efficiently. A team can log plenty of hours and close plenty of tickets while still losing nearly half the day to avoidable friction. Wrench time is the metric that catches that gap, because it measures the quality of the hour, not just the existence of it.
The KPI Dashboard Every Maintenance Leader Should Have
Wrench time rarely moves in isolation. It is connected to a handful of other productivity indicators that, tracked together, tell a much fuller story than any single number on its own. Below are the five metrics that belong on the same dashboard as wrench time.
Four Levers That Actually Move Wrench Time
| Lever | What It Fixes | Typical Impact |
|---|---|---|
| Mobile work order access | Eliminates trips back to a shared terminal to check or close tickets | 8 to 12 percent gain |
| Parts availability visibility | Cuts the time technicians spend searching or waiting on inventory | 6 to 10 percent gain |
| Route-optimized scheduling | Groups nearby work orders to reduce travel between zones | 5 to 9 percent gain |
| Digital documentation access | Removes time lost hunting for manuals or asset history on paper | 4 to 7 percent gain |
How Oxmaint Recovers Wrench Time
Why Wrench Time Justifies Headcount Investment
When a maintenance leader asks for additional technicians, the conversation almost always turns to utilization. A low wrench time number makes that ask much harder to defend, because leadership reasonably wonders whether the existing team is being used efficiently before approving more headcount. A documented, improving wrench time trend flips that conversation entirely, showing that the team has already squeezed out the avoidable waste and any additional hires would go directly toward productive repair work rather than more walking and waiting.
The same data works in the opposite direction too. When wrench time is already strong and the backlog keeps growing anyway, that is a legitimate signal that the team is genuinely understaffed for the workload, not inefficient. Either way, the number turns a subjective staffing debate into a data-backed conversation both operations and finance can actually work from. Finance teams in particular respond well to this framing, since it separates a productivity problem from a capacity problem, and the two require completely different investments to solve.
Who Relies on Wrench Time Data Day to Day
Maintenance managers use the metric to decide where to focus process improvement efforts first, since the breakdown chart makes it obvious whether travel, parts, or documentation is the biggest drag on a given week. Plant directors use the trend line during budget season to justify tooling and mobile device investments that would otherwise be hard to quantify in a spending request. Reliability engineers cross-reference wrench time against schedule compliance to figure out whether a slipping preventive maintenance program is a planning problem or an execution problem, which changes the fix entirely. Human resources and workforce planning teams reference the same data when building out staffing models for a new facility, since a realistic wrench time assumption produces a far more accurate headcount forecast than an industry rule of thumb pulled from a generic benchmark report.