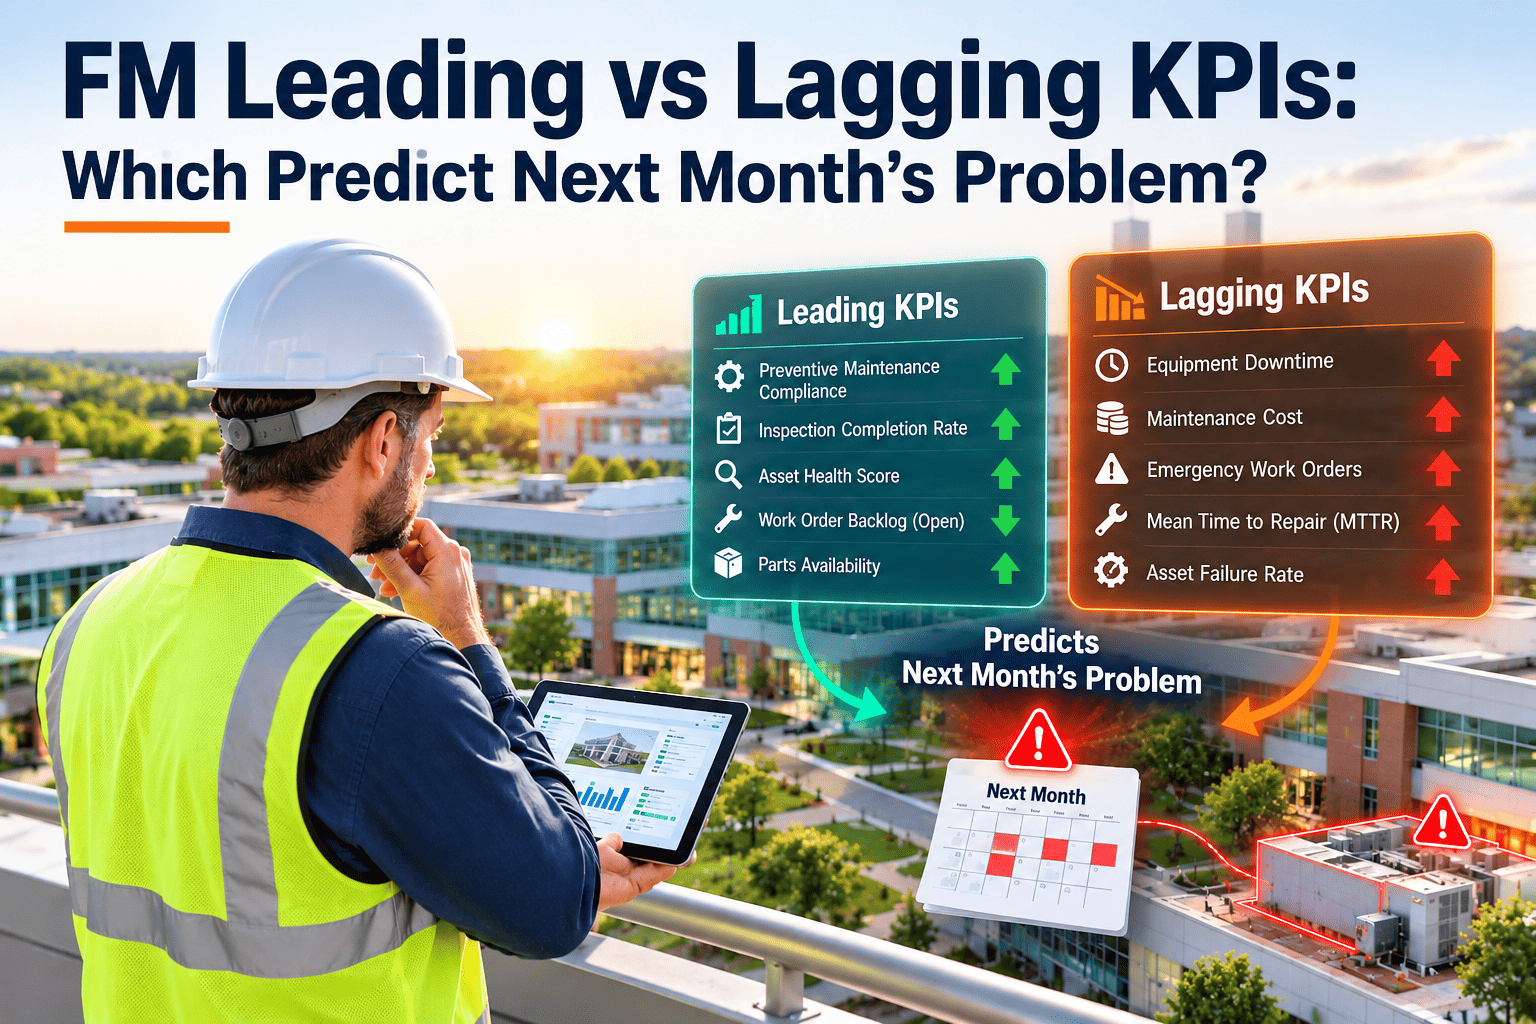
Most facility dashboards report the past. Emergency work orders, downtime hours, cost overruns and tenant complaints all tell you a problem has already landed on someone's desk. Leading indicators move first: schedule compliance slipping, the oldest work order getting older, planned work shrinking against reactive work. This guide separates the two families for commercial FM teams, shows the typical delay between a leading signal and the lagging outcome it warns about, and gives a weekly review routine built on data you already hold. If you want to see how a CMMS reports PM compliance and backlog age in one place, start with Oxmaint.
FM Leading vs Lagging KPIs: Which Predict Next Month's Problem
Read the signals that move first. Track schedule compliance, backlog age and planned-to-reactive balance, then use lagging results to confirm what the leading numbers already told you.
Why lagging KPIs arrive too late
A lagging KPI is an outcome. It is measured after the event, so by the time it turns red the failure, the emergency call-out and the unhappy tenant are all in the past. Lagging metrics are still essential: they prove whether your strategy worked and they feed budgets, service level reviews and board reports.
The reporting problem in commercial FM
Monthly packs for landlords and occupiers are naturally built from outcomes, such as completed work orders, cost against budget and complaint counts. That makes the pack accurate and also late. A leading indicator is a measure of an input or a behavior that tends to come before an outcome, which gives the team time to act while the fix is still cheap.
Plain definition
- Leading: measures activity or condition now, and points to where results are heading.
- Lagging: measures the result after the fact, and confirms what happened.
- Rule of thumb: if a number can only change after something broke, it is lagging.
Leading and lagging FM metrics side by side
| Question | Leading indicator | Lagging indicator |
|---|---|---|
| What does it tell you? | Where performance is heading | What already happened |
| When is it available? | Daily or weekly, while work is open | After the failure or at period end |
| Can you still change the result? | Yes, through scheduling, parts and crew decisions | No, you can only respond and report |
| Typical examples | PM schedule compliance, backlog age and size, planned versus reactive ratio, inspection completion rate, work order aging, parts availability at job start | Emergency work order count, equipment downtime, cost overrun, tenant complaints, equipment failures |
| Main risk | Gaming or poor data entry can make a green number meaningless | Too late to prevent the event you are measuring |
| Best use | Weekly operational steering | Monthly and quarterly proof of results |
Neither family is better. Leading metrics steer the week, lagging metrics grade the month, and each lagging number should have at least one leading partner.
The causal chain: from early signal to next month's problem
Leading and lagging indicators are connected by a chain of cause and effect. The delay between links depends on the asset, its age, its duty and the failure mode, so treat the timing below as directional rather than a fixed schedule. Short-cycle consumables such as filters may show consequences within weeks. Slow-wearing plant may take a quarter or more.
Leading signal
Critical PMs start slipping. Schedule compliance drops and inspection rounds are skipped or closed late.
Early weeks
Backlog grows and the oldest open items age. Small defects such as a noisy bearing or a weeping valve stay unaddressed.
Weeks to months
Condition degrades. Reactive work crowds out planned work, so even more PMs are missed.
Lagging outcome
Emergency work orders, downtime, overtime spend and tenant complaints finally show up in the monthly report.
The loop that makes it worse
Step 3 feeds step 1. Every emergency call-out pulls technicians off scheduled work, which lowers compliance further. This feedback loop is why a modest dip in leading metrics can turn into a serious lagging problem within a quarter or two.
What each leading indicator is warning you about
A leading KPI is only useful when you know which lagging problem it predicts. This pairing table shows the typical relationship. These are directional links drawn from common reliability practice, not guaranteed correlations, so confirm them against your own work order history.
| Leading indicator | What a worsening trend warns of | Lagging result it tends to precede |
|---|---|---|
| PM schedule compliance | Preventive tasks are not being done on time | More breakdowns and emergency work orders |
| Backlog size (in crew weeks) | Demand is outrunning crew capacity | Longer repair times, rising overtime and complaints |
| Backlog age distribution | Low-priority defects are being left to grow | Minor faults turning into failures and cost overruns |
| Planned versus reactive ratio | The team is firefighting instead of preventing | Unplanned downtime and budget variance |
| Inspection completion rate | Early defects and compliance gaps are going unseen | Surprise failures and audit findings |
| Work order response and aging | Requests are waiting longer than the service level allows | Tenant complaints and SLA penalties |
| Parts availability at job start | Jobs stall waiting for materials | Extended downtime and repeat visits |
Six leading indicators worth tracking in detail
PM schedule compliance
The share of scheduled preventive tasks completed within their allowed window. Reliability literature commonly treats a figure above 90% as a healthy target for critical PMs, but your own baseline matters more than a generic number. High compliance with flat failure rates is a hint that PM task content needs review.
Backlog size and age
Backlog is open work that is ready or waiting to be done, usually expressed in crew weeks. One published guide cites 4 to 6 crew weeks as typical for process industries and a tighter 2 to 4 weeks for sectors such as pharma and food. Commercial FM varies, so set a range and watch the direction.
Planned versus reactive ratio
The proportion of labor hours spent on planned work compared with reactive work. A rising reactive share is one of the earliest signs that a team has lost control of its schedule, and it often precedes a spike in emergency work orders.
Inspection completion rate
Whether rounds, life-safety checks and condition inspections happened when due. Missed inspections remove the early warning that lets you raise a corrective work order before the asset fails.
Work order response and aging
How long requests wait before acknowledgement, assignment and completion. Ageing that stretches on a particular trade, building or priority class tells you where a service failure is forming.
Parts availability at job start
The portion of jobs where the required parts are on hand when the technician begins. Low availability turns a short repair into a multi-visit job and quietly lengthens downtime.
Reading backlog age: the bucket view
Backlog size alone hides risk. Two buildings can both have 300 open work orders, yet one has everything under two weeks old while the other is carrying items from last year. Age buckets show which situation you are in. The example below is illustrative only and is not benchmark data.
Illustrative open work orders by age: a healthy profile versus a warning profile
Healthy profile
Warning profile
What the healthy shape means
Work flows through. Most items are new, the old tail is short, and the team is closing work about as fast as it arrives.
What the warning shape means
A growing middle and an old tail indicate deferred defects. These are the items most likely to become next month's emergency call-outs, so review them first.
See your leading indicators before the monthly report
Oxmaint gives maintenance teams PM scheduling, work order tracking, backlog and aging reports and dashboards in one workspace, so early warning numbers are not buried in spreadsheets.
Matching lagging indicators to a leading partner
Emergency work order count
Pair with PM schedule compliance and planned versus reactive ratio.
Equipment downtime
Pair with backlog age on critical assets and parts availability at job start.
Cost overrun
Pair with reactive share of labor hours and overtime trend.
Tenant complaints
Pair with request response time and work order aging by priority.
Equipment failures
Pair with inspection completion rate and overdue corrective actions.
Audit findings
Pair with life-safety inspection completion and record completeness.
How long before a leading signal shows up as a problem
Teams often ask for a fixed number of weeks. There is not one, and anyone who offers a universal figure is guessing. What you can say is how the delay tends to behave, and then measure it in your own portfolio.
Shorter delay
- Continuous-duty or heavily loaded equipment
- Consumables such as filters, belts and lamps
- Assets already near end of life
- Seasonal peaks, such as cooling plant before summer
Longer delay
- Lightly used, well-built equipment
- Redundant systems that mask early wear
- Slow-developing issues such as corrosion and roof ageing
- Assets with strong condition monitoring
How to find your own lag
- Pick one asset class, such as air handlers
- List months when PM compliance dipped
- Check when failures rose afterwards
- Repeat across sites and compare
A weekly leading-indicator review routine
Leading metrics only pay off if someone acts on them at a regular cadence. Run this review weekly with the FM manager, planner and lead technicians. It should take less than an hour when data is clean.
Check PM compliance
Review last week's compliance for critical assets and list every missed PM with a reason.
Open the backlog by age
Look at the oldest buckets first and confirm each aged item has an owner and a plan.
Compare planned to reactive
Note the labor share spent on reactive work and what drove any increase.
Confirm inspections done
Verify rounds and safety checks closed on time, and chase any overdue ones.
Scan response times
Check requests approaching or breaching service levels, grouped by priority and building.
Check parts for next week
Match scheduled jobs against stock so no work order starts without its parts.
Assign recovery actions
For each leading metric trending the wrong way, name one action, one owner and one date.
Record the lagging check
Log emergency count and complaints so you can see over time which leading signals predicted them.
Where a CMMS fits
Leading indicators depend on clean, timely work order data, which is difficult to maintain in spreadsheets and shared inboxes. A CMMS such as Oxmaint records the underlying events as they happen, so the numbers are a by-product of normal work rather than a month-end exercise.
Capabilities that support early-warning reporting
Preventive maintenance scheduling with compliance reporting shows what was due and what was done. Work order aging and backlog reports expose the old tail. Inspections capture condition findings and can raise corrective work. Inventory tracking supports parts availability, and dashboards bring these together for the weekly review.
Data discipline still matters
- Close work orders on the day work finishes, not at month end.
- Use consistent priority and failure codes.
- Tag every work order to an asset and location.
- Mark work as planned or reactive when it is created.
Common mistakes with leading and lagging KPIs
Tracking only lagging results
Reports explain what went wrong but never prevent it. Add at least one leading partner for each outcome you report.
Treating compliance as quality
A PM closed in thirty seconds counts as compliant. If compliance is high and failures are flat, audit task content and completion quality.
Averaging away the old tail
Average backlog age hides a handful of very old, high-risk items. Use age buckets and review the oldest first.
Assuming a fixed lag
Delay varies by asset and duty. Test the relationship with your own history before promising a timeline to stakeholders.
Too many indicators
Twenty leading metrics produce no action. Start with four to six and attach an owner to each.
Rewarding the number, not the outcome
If teams are paid on a metric alone, they will manage the metric. Always check it against the lagging result it should protect.
Turning the signals into a monthly story
For the FM team
Lead with the trend of three or four leading metrics and the actions underway, then show the lagging outcomes they are expected to protect.
For property owners and occupiers
Explain risk in plain terms. A rising count of overdue critical PMs is easier to defend than a surprise outage, and it shows the team is managing ahead of problems.
For finance
Link reactive share and overtime trend to budget variance so that preventive spending is seen as cost avoidance rather than overhead.
Frequently asked questions
What is the difference between a leading and lagging indicator in facility management?
A leading indicator measures current activity or condition, such as PM compliance or backlog age, and points to future results. A lagging indicator measures an outcome after it happens, such as downtime or emergency work orders.
Which commercial FM leading indicators should I start with?
Start with PM schedule compliance on critical assets, backlog age, and planned versus reactive ratio. Add inspection completion and parts availability once the first three are trusted and reviewed weekly.
How far ahead does a leading KPI predict problems?
It depends on the asset, its duty and the failure mode. Delays can range from weeks to several months, so measure the lag in your own history rather than relying on a fixed figure.
Can a CMMS report leading indicators automatically?
Yes, if work orders and PMs are recorded accurately. Oxmaint provides PM compliance, backlog and aging reports and dashboards; you can book a demo to see them applied to your portfolio.
Do I still need lagging KPIs?
Yes. Lagging KPIs confirm whether your leading indicators are predicting the right outcomes and are what owners, finance and auditors expect to see in reports.
Catch next month's problem this month
Put PM compliance, backlog age and work order aging on one dashboard and review them every week. Oxmaint helps commercial FM teams see early signals while there is still time to act.