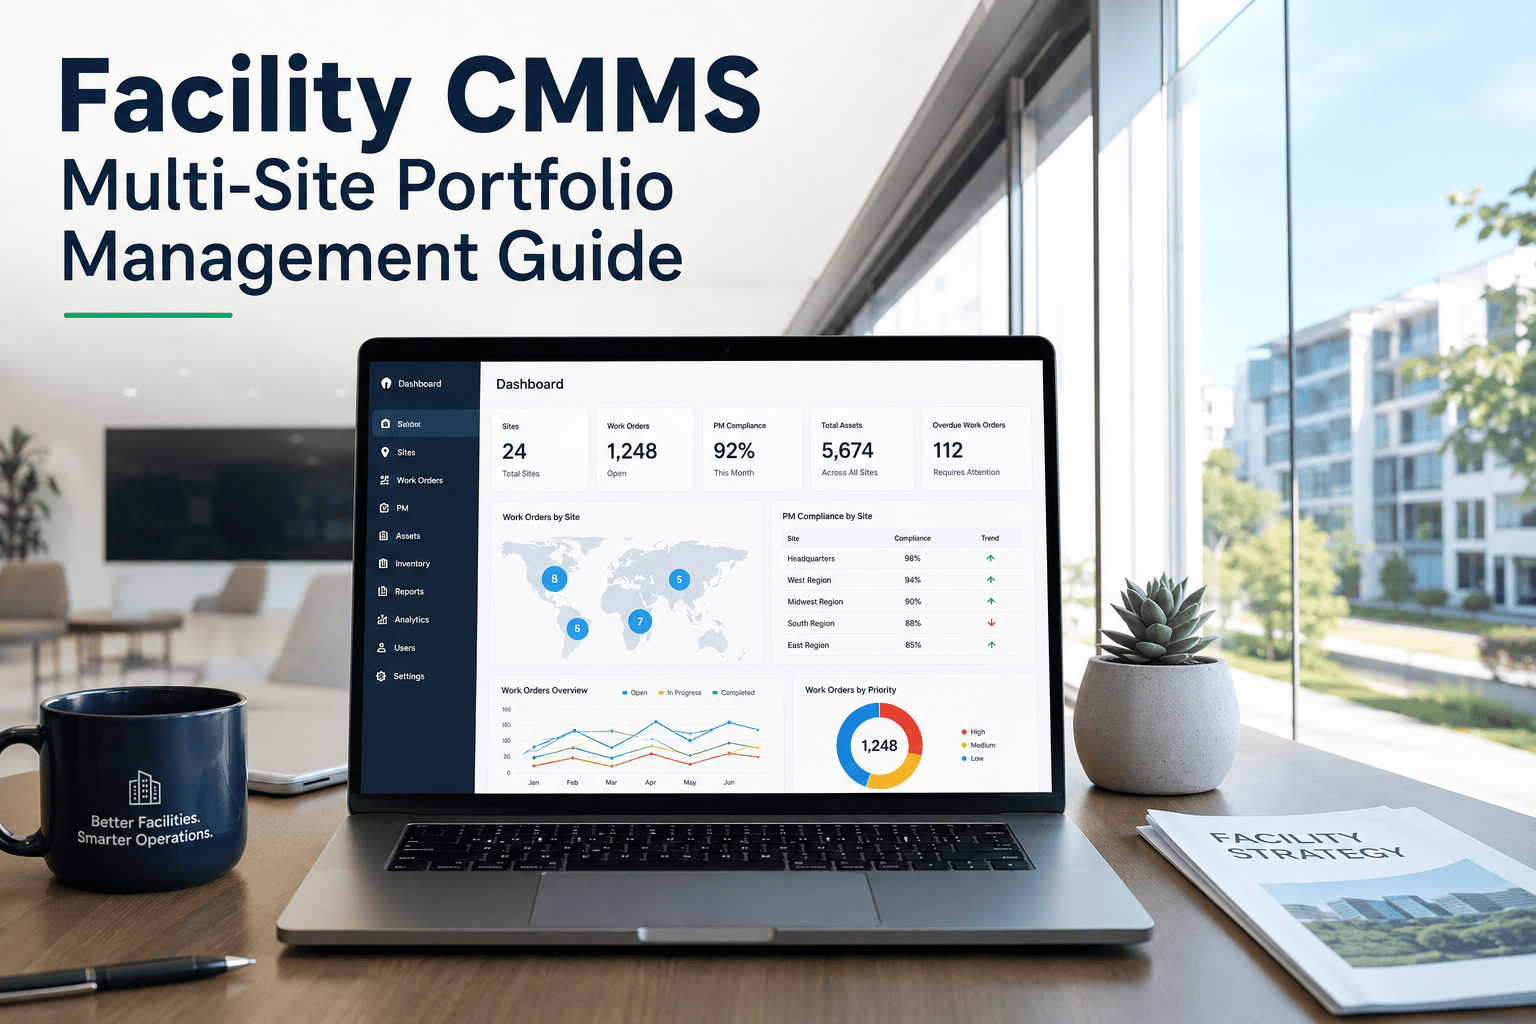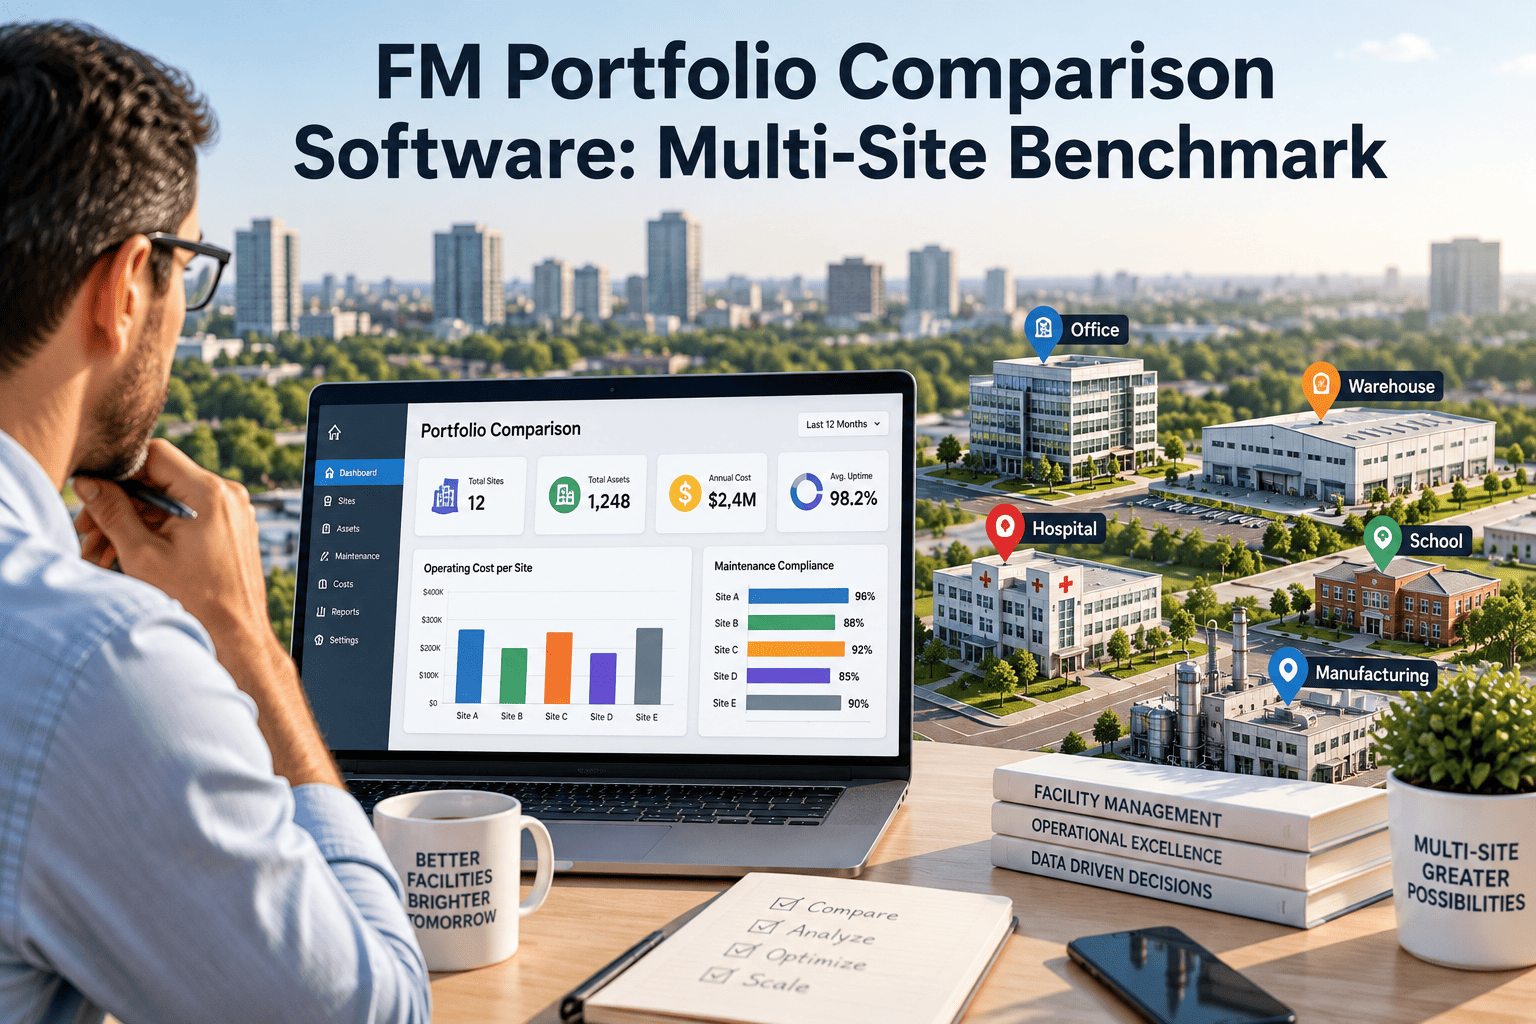
Ask a regional facilities director which of their eight sites is quietly bleeding the maintenance budget and most cannot answer without days of pulling spreadsheets from local managers. Portfolio comparison software closes that gap by putting every site's PM compliance, cost per square foot, and reactive work ratio on one screen, so underperformance surfaces on its own instead of waiting to be discovered in a missed compliance audit — see how it works with OxMaint's portfolio dashboard.
Which of your sites is actually underperforming — and can you prove it in numbers?
Facility organizations running fragmented, per-site systems report a 25–40% variance in PM compliance between locations that are supposed to run the same playbook. Without a shared data structure, that gap stays invisible until a regulator, a board member, or a budget review forces the question.
Why site-by-site tools cannot answer portfolio-level questions
Most multi-site organizations did not choose fragmentation deliberately — it accumulated. A site added a spreadsheet, a region adopted a local work order tool, an acquisition brought in its own CMMS, and now nobody can run one query across the whole estate. The result is a facilities function that can describe any single building in detail but cannot rank its own portfolio.
The slow accumulation of an unbenchmarked portfolio
Fragmentation rarely happens in one decision. A new building opens and, under deadline pressure, the site team stands up whatever tool they know rather than waiting for corporate rollout. An acquisition brings in a facility that already runs its own CMMS, and migrating it gets deprioritized behind more urgent integration work. A regional office switches vendors independently because a local contract expired. None of these choices are unreasonable on their own — the damage is cumulative.
Two years later, a director trying to compare five sites discovers each one defines "preventive maintenance compliance" slightly differently, tracks cost in a different format, and stores asset history in a system nobody else can query. At that point, rebuilding comparability is not a software purchase — it is a data migration project layered on top of one.
Inconsistent metric definitions
One site counts a work order as "on time" if closed within the week; another counts only same-day completion. Neither number is wrong, but they cannot be compared.
No shared cost taxonomy
Labor, parts, and contractor spend are categorized differently site to site, so a portfolio-wide cost-per-square-foot figure has to be manually reconciled before it means anything.
Reporting cadence mismatch
Some sites report weekly, others monthly or quarterly, so a portfolio snapshot is always a blend of current and stale data depending on which site is asked.
A comparison is only as good as the structure underneath it
Before any dashboard can rank sites against each other, the data underneath needs a consistent hierarchy. A flat list of buildings with no relationship between them produces totals, not comparisons. The four-level structure below is what makes true site-by-site benchmarking possible.
With this structure in place, a KPI recorded at the asset level — a completed PM, a logged repair cost, a failed inspection — rolls up automatically to its site, its region, and the full portfolio, without anyone re-entering data at each level.
What a live portfolio scorecard actually shows
Rather than a single blended number, a usable portfolio dashboard shows each site's standing against the same set of metrics, so outliers are visible at a glance instead of buried in an average.
A scorecard like this turns a regional review meeting from a status update into a triage exercise — the sites needing intervention are identified before the meeting starts, not discussed one by one from memory.
See your own sites ranked side by side
Import your portfolio and get a live scorecard across every location in under an hour.
How a composite site score is calculated
Ranking sites fairly means combining several metrics into one comparable figure rather than judging on cost alone, which unfairly penalizes older buildings, or PM compliance alone, which ignores cost efficiency. A composite score weights the factors that matter to the portfolio.
OxMaint calculates this automatically per site from live work order and cost data, with weights configurable per portfolio so a healthcare estate can prioritize compliance differently than a warehouse network.
A composite score does not replace looking at individual metrics — it gives a director a fast way to sort forty sites down to the five worth a closer look, before drilling into the underlying PM compliance, reactive ratio, or cost trend behind any one score.
Where portfolio comparison efforts go wrong even with the right software
Buying a centralized platform solves the data problem, but rollout still needs discipline. The most common ways a portfolio comparison initiative underdelivers have little to do with the software itself.
What changes when every site reports through one system
| Portfolio Metric | Fragmented, Per-Site Tools | Centralized OxMaint Portfolio |
|---|---|---|
| PM compliance comparison | Not possible — incompatible data formats | Real-time, standardized across every site |
| New site onboarding | 3–6 months to stand up a local system | 1–2 weeks using shared templates |
| Portfolio KPI reporting | Manually compiled, 3–5 days per cycle | Live dashboard, zero manual assembly |
| Best-practice sharing | Verbal or email, inconsistently adopted | Standard SOPs pushed to every site |
| Underperforming site detection | Found during an audit or after failure | Flagged automatically against portfolio average |
One dataset, three different views of the same portfolio
A comparison tool only earns adoption if every stakeholder finds their own view in it, rather than being handed a dashboard built for someone else's job.
VP / Director of Facilities
Full portfolio KPI dashboard, site-vs-site ranking, capital replacement forecast, and compliance status across every location — the view a board report is built from.
Regional Manager
Their assigned region only — three to eight sites compared against each other and against the portfolio average, with drill-down into the sites falling behind.
Site Manager
Their own building's work orders, PM schedule, and asset history — plus how their site ranks against comparable locations in the portfolio, without the noise of unrelated sites.
Building comparable data across every site, automatically
OxMaint's asset hierarchy — Portfolio, Property, System, Asset, Component — mirrors how multi-site organizations are actually structured, so comparison is a default output of normal maintenance work, not a separate reporting project.
Standardized PM Templates
Preventive maintenance schedules are pushed from a central template library, so every site's compliance rate is measured against the same definition of "on time."
Cross-Site Work Order Queue
Filter open, overdue, and completed work orders by site, region, or trade from a single screen instead of logging into separate local systems.
Shared Inventory Visibility
See spare parts availability across nearby sites before ordering, reducing duplicate stock and the excess inventory that fragmented systems quietly accumulate.
Portfolio Compliance Dashboard
Regulatory inspections, certifications, and overdue compliance items are visible per site and rolled up portfolio-wide, so gaps surface before an audit finds them.
Frequently asked questions about FM portfolio comparison software
How many sites do I need before portfolio comparison software makes sense?
Even a three-site portfolio benefits once local systems stop matching each other. The gains scale with site count, but the underlying problem — no shared benchmark — starts at two.
Can OxMaint import data from our existing per-site systems?
Yes. Asset registers, open work orders, and PM schedules can be imported per site during onboarding, and historical cost data is mapped into the shared hierarchy so comparisons are accurate from day one.
Will regional and site managers still have their own view, or just the portfolio total?
Role-based access means a site manager sees their building, a regional manager sees their assigned sites, and a director sees the full portfolio — all from the same underlying data.
How does OxMaint flag an underperforming site?
Each site's KPIs are compared automatically against the portfolio average and configurable thresholds, so a site falling outside normal range is highlighted rather than requiring manual review. Get Started to set your own thresholds.
How long does portfolio-wide rollout take?
Most organizations onboard their full portfolio in three to six weeks, with new sites added afterward in one to two weeks using pre-built templates rather than a fresh implementation each time.
Stop finding out about underperforming sites after the fact
Get every site benchmarked against the same metrics, on the same dashboard, starting today.
Free 14-day trial · No credit card