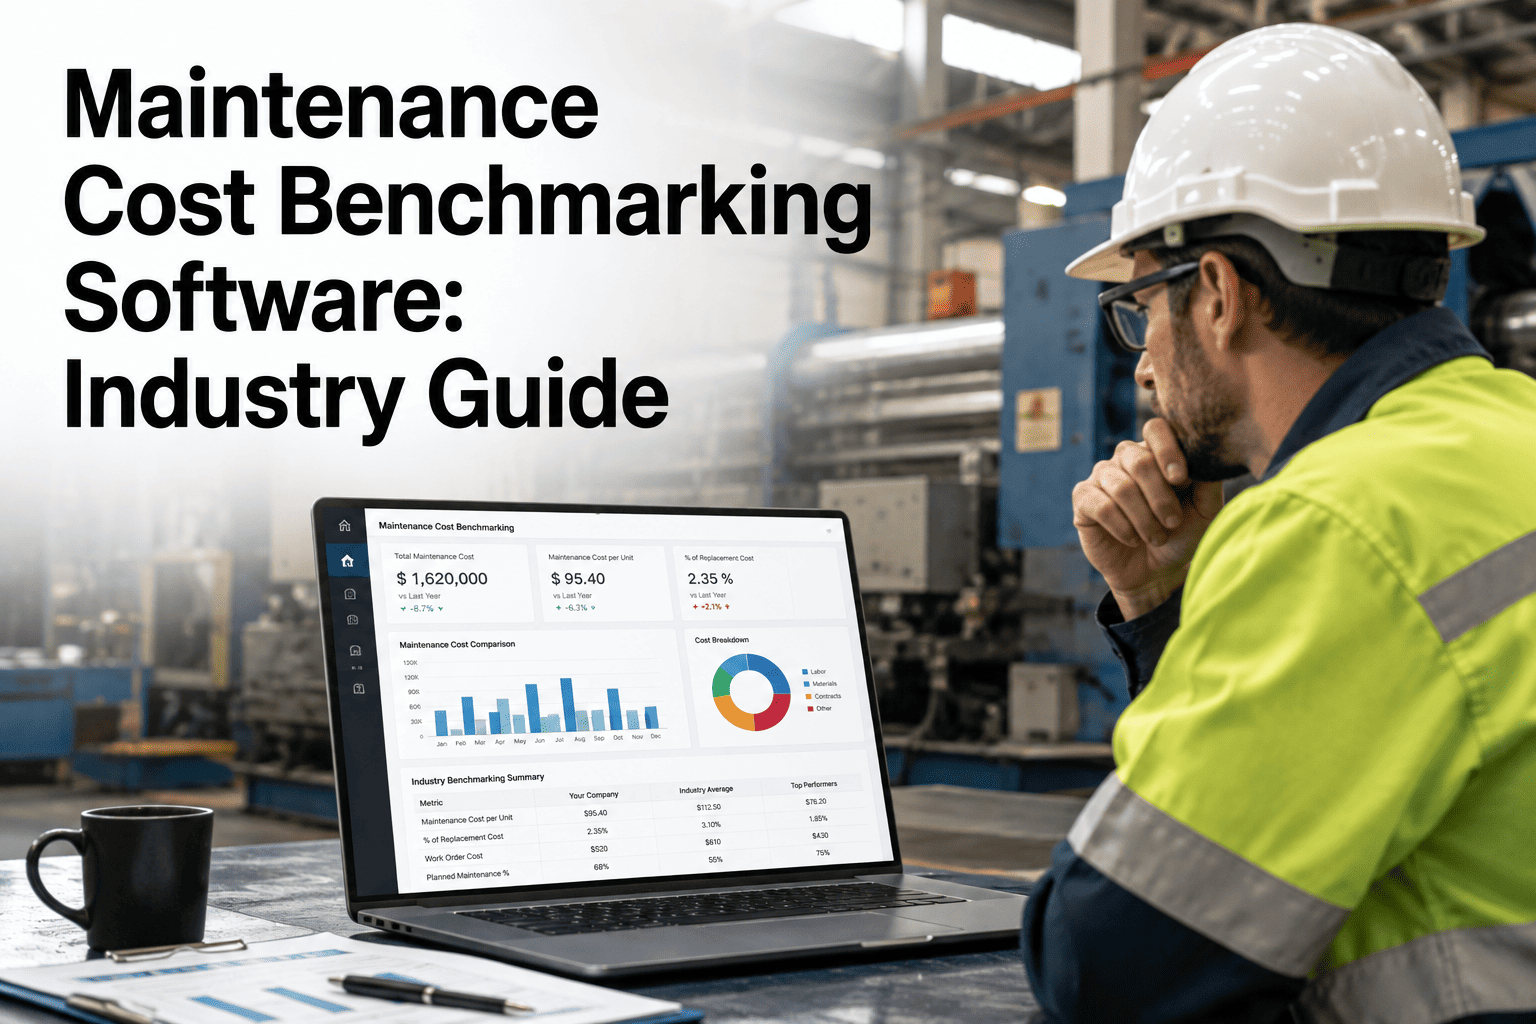
Every facility director eventually gets asked the same question in a budget meeting: is what we spend on maintenance actually reasonable, or are we quietly overpaying? Without a benchmark, that question has no real answer — a maintenance budget approved because it matches last year's number, not because it reflects industry norms. IFMA, BOMA, and Plant Engineering publish exactly the data needed to close that gap, covering cost per square foot, cost as a percent of replacement asset value, planned maintenance ratios, and reactive work order rates across building types. The hard part isn't finding the numbers — it's tracking your own facility's data consistently enough to compare against them, which is where a connected maintenance management platform changes the picture.
Stop Guessing Whether Your Maintenance Budget Is Competitive
Four benchmark metrics separate top-quartile facilities from reactive, overspending ones — cost per square foot, cost as a percent of replacement asset value, planned maintenance ratio, and reactive work order rate. See exactly where your numbers should land, and what to track to get there.
The Four Numbers Every Benchmark Report Comes Back To
Every published IFMA, BOMA, and Plant Engineering study eventually reduces to the same four metrics — the ones below are the fastest way to tell a healthy maintenance program from one that is quietly bleeding budget.
Cost per Square Foot, by Building Type
Building type and class are the strongest predictors of maintenance spend — comparing your facility against the wrong category is the single most common benchmarking mistake.
| Building Type | Typical Cost / Sqft | Primary Cost Driver | Benchmark Signal |
|---|---|---|---|
| Office (Class A) | $10 – $15 | HVAC, BMS, life safety systems | Above range signals reactive spend |
| Office (Class B/C) | $8 – $11 | Aging systems, fewer redundancies | Below $3.20 often signals deferral |
| Industrial / Manufacturing | $4 – $10 | Production equipment intensity | Best performers stay under $4.50 |
| Healthcare | $10 – $18 | Compliance, uptime, life safety | Top quartile still exceeds 68% PM |
| Retail / Education | $5 – $9 | Distributed, lower-density assets | Leaders achieve over 55% planned work |
Where Does Your Spend Fall on the RAV Scale?
Cost as a percent of replacement asset value is the cleanest way to compare maintenance spend across facilities of very different sizes — it strips out square footage and equipment age and leaves a single, comparable number.
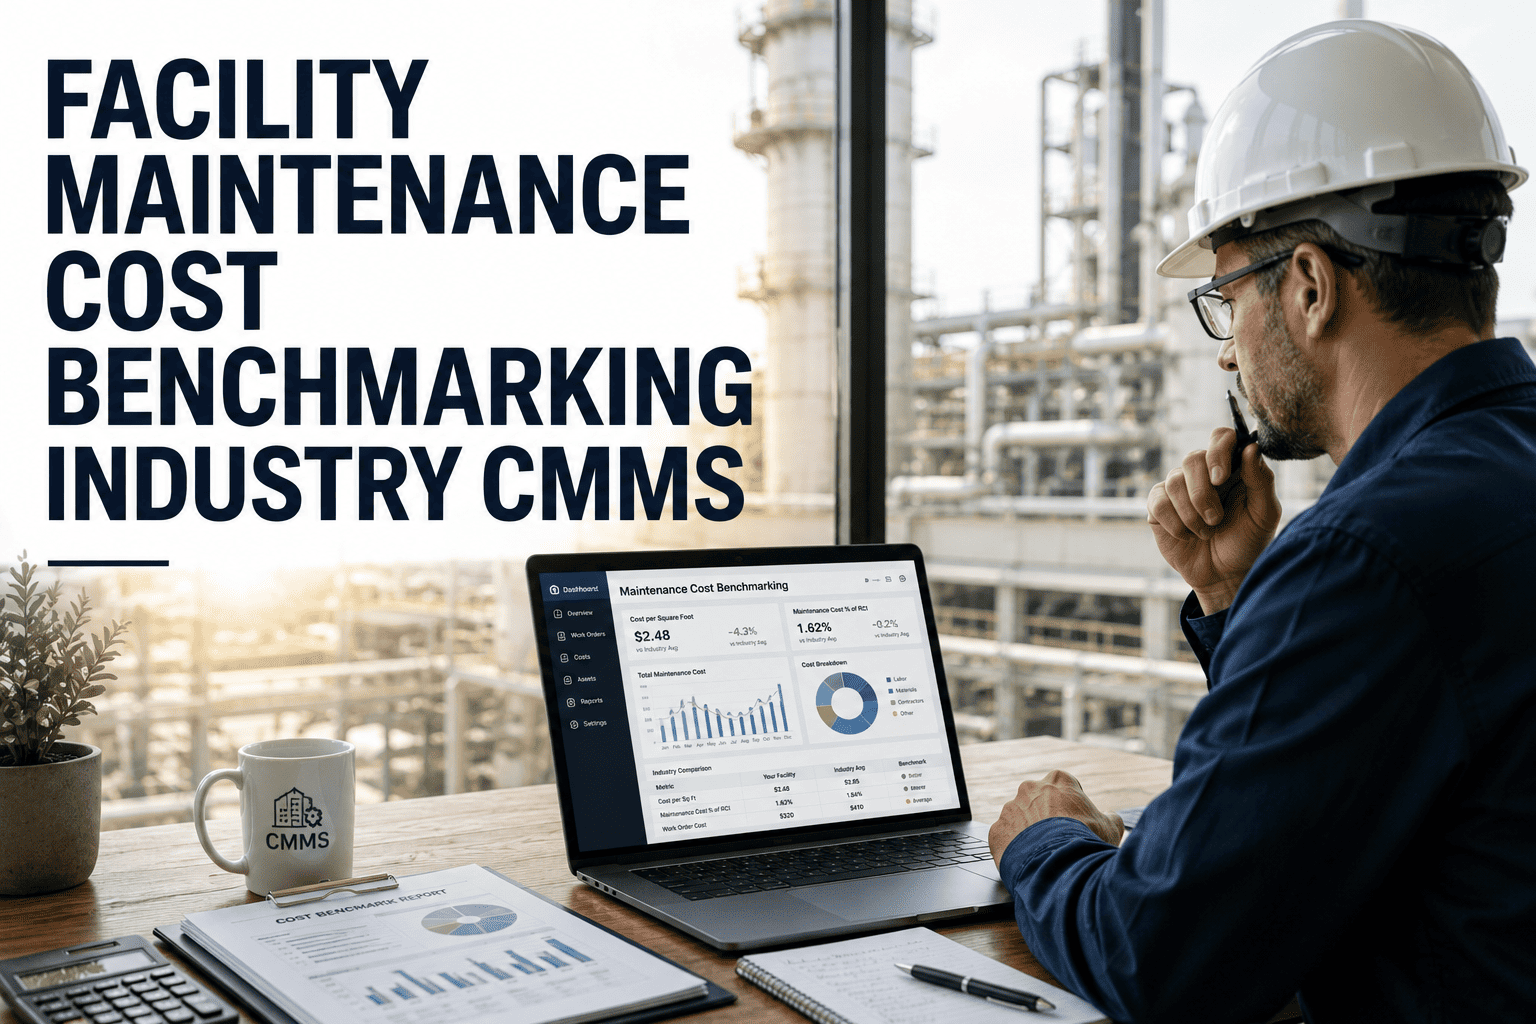
Oxmaint pulls cost, work order, and asset data into one dashboard and benchmarks it against IFMA, BOMA, and Plant Engineering standards, so the comparison is always current instead of a once-a-year spreadsheet exercise.
How to Benchmark Your Own Facility
The facilities that struggle with budget approval almost never have a spending problem — they have a comparison problem. They know their own number but not what it means. Once a team can say "we run 3.1% of RAV against a 2 to 4% healthy range, and our planned maintenance ratio is 71%," the budget conversation stops being a negotiation and starts being a data review. The teams that benchmark quarterly instead of annually catch drift in reactive spend months before it shows up as a blown budget line.
Frequently Asked Questions
What is a healthy maintenance cost as a percent of RAV?
Facilities should target 2–4% of replacement asset value annually, with manufacturing plants at world-class level closer to 2–3%. Start a free trial to calculate your own RAV ratio automatically.
How is Facility Condition Index different from cost benchmarking?
FCI measures deferred maintenance against replacement value, while cost benchmarking measures active annual spend — the two together show both backlog risk and current efficiency.
What planned maintenance ratio should our team be hitting?
Top-quartile facility teams keep planned work above 68% of total work orders, well above the wider industry average. Book a demo to see this ratio tracked live on your own work orders.
Why does building class change the benchmark so much?
Class A buildings carry premium finishes, complex BMS and life safety systems, and higher tenant expectations, all of which raise the cost floor compared to Class B or C properties.
How often should a facility re-run its benchmark comparison?
Quarterly reviews catch drift in reactive spend long before it becomes a blown annual budget. Try Oxmaint free to keep cost, RAV, and PM ratios updated automatically.
Turn Your Maintenance Spend Into a Number You Can Defend
Oxmaint tracks cost per square foot, cost as a percent of RAV, planned maintenance ratio, and reactive work order rate automatically, so every budget conversation starts with data instead of a guess.