Most facility managers approve budgets without knowing if their maintenance spend is efficient — until they benchmark against real industry data. Without standards, reactive repairs inflate costs by 18–25% and planned maintenance lags below 50%."Benchmarking Facility Maintenance Costs: Industry Standards and Metrics" helps facility managers compare their maintenance costs against industry standards. It covers key metrics such as cost per square foot, planned maintenance percentages, and staffing ratios across different building types. This guide offers valuable insights into optimizing maintenance budgets and improving cost efficiency. By benchmarking against industry data, facilities can identify areas for improvement and ensure they are aligned with best practices in cost management. Compare your facility metrics with Oxmaint’s analytics or book a 30‑min benchmarking review to uncover hidden savings.
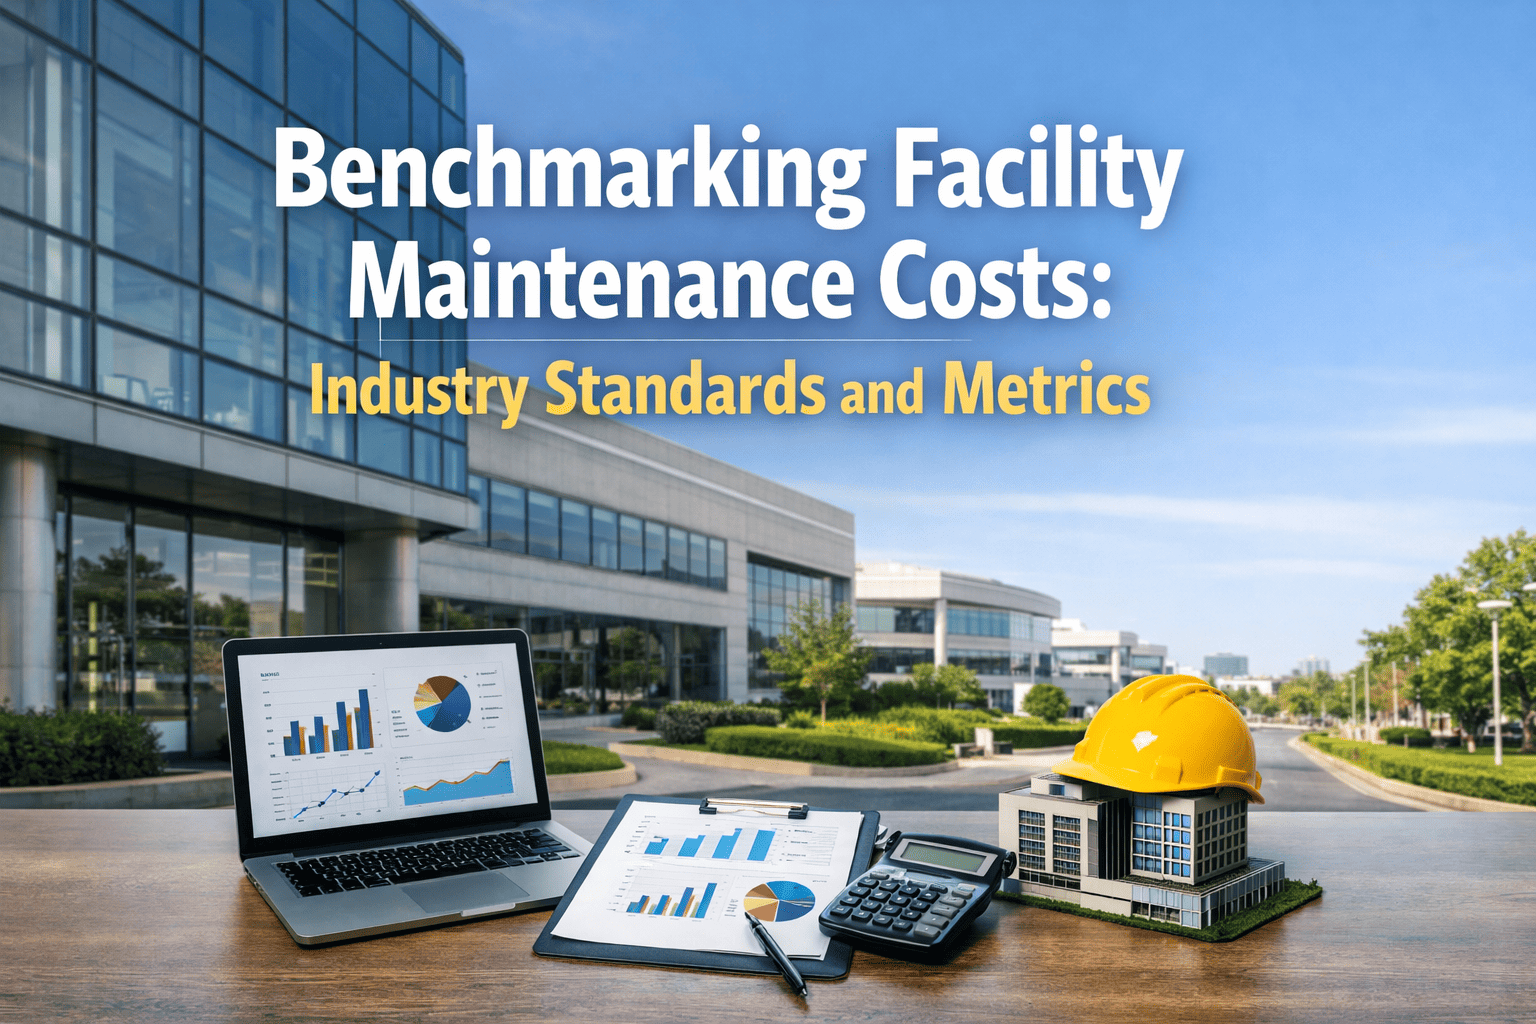
Facility Maintenance Costs: Industry Standards & Metrics That Matter
Stop guessing if your spending is competitive. Compare cost per square foot, planned vs. reactive ratio, and staffing benchmarks across office, industrial, healthcare, and retail facilities.
Industry Benchmarks at a Glance
Benchmarking transforms maintenance from a cost center into a strategic asset. The data below reflects 2025 IFMA, BOMA, and Plant Engineering standards — use these KPIs to locate your facility’s performance gap.
Detailed Benchmarking by Facility Type
| Facility Type | Cost per Sq Ft (annual) | Planned Maintenance % | Reactive Maintenance % | Staff per 100k Sq Ft |
|---|---|---|---|---|
| Office (Class A) | $2.10 – $3.50 | 55% – 68% | 32% – 45% | 0.9 – 1.5 |
| Light Industrial | $3.40 – $5.20 | 58% – 72% | 28% – 42% | 1.2 – 2.0 |
| Heavy Manufacturing | $4.20 – $6.80 | 62% – 78% | 22% – 38% | 1.8 – 2.8 |
| Healthcare (acute care) | $5.50 – $8.50 | 65% – 80% | 20% – 35% | 2.0 – 3.5 |
| Retail / Grocery | $1.80 – $3.00 | 45% – 60% | 40% – 55% | 0.7 – 1.3 |
| Warehouse / DC | $2.20 – $4.10 | 50% – 68% | 32% – 50% | 0.8 – 1.6 |
Benchmark sources: IFMA 2025, BOMA 2024, Plant Engineering KPI study. Planned maintenance % = scheduled vs. total work orders.
Hidden Cost Drivers: Where Your Budget Leaks
Beyond benchmarks, specific operational gaps drain maintenance budgets. Targeting these three areas yields the fastest ROI improvement.
How to Conduct a Benchmarking Audit in 5 Steps
A structured audit helps you gather the right data and compare apples-to-apples. Follow this process before you implement changes.
Sign up for Oxmaint to automate this audit — real-time dashboards replace manual spreadsheets.
Deep Dive: Key Maintenance KPIs You Must Track
Beyond cost per square foot, these four metrics separate top performers from the rest. Monitor them monthly.
Case Study: How a 2M sq ft Warehouse Cut Costs by 27%
A Midwest distribution center with 2 million square feet and 18 technicians was spending $5.20 per sq ft — well above the $3.80 industry median. After a benchmarking audit, they implemented three changes:
- Shifted 40% of reactive work to planned PMs using asset condition data.
- Integrated CMMS with ERP to eliminate double data entry and reduce inventory by 14%.
- Introduced mobile work orders to improve technician compliance from 62% to 91%.
Within 8 months, cost per sq ft dropped to $3.80, planned maintenance rose from 48% to 69%, and month-end close time fell from 5 days to 1 day. Book a demo to see the full case study and apply similar tactics to your facility.
Staffing & Cost Efficiency: Where Do You Stand?
Maintenance staffing ratios directly impact both cost per square foot and equipment uptime. Use these breakpoints to optimize your team structure.
Book a demo to benchmark your actual crew productivity and get tailored staffing recommendations based on your asset portfolio.
How to Improve Your Benchmark Scores
Move from reactive to planned
Facilities with planned maintenance >65% reduce annual cost per sq ft by 22% on average. Schedule preventive work using asset condition data.
Implement CMMS + ERP visibility
Closing the cost loop cuts reconciliation errors and provides real budget vs. actuals. See how Oxmaint integrates with your ERP to automate cost tracking.
Train on mobile-first work orders
Technicians logging parts/labor on mobile improves data accuracy by 40% and boosts planned maintenance completion rates.
Optimize spare parts inventory
Run ABC analysis: 80% of stock value comes from 20% of SKUs. Reduce slow-moving items and set min/max levels based on usage data.
Frequently Asked Questions
Turn Benchmarks Into Actionable Savings
Stop guessing if your maintenance budget is efficient. Oxmaint gives you live dashboards comparing your cost per sq ft, planned maintenance ratio, and staffing against your industry peers. See exactly where to cut waste and improve reliability.