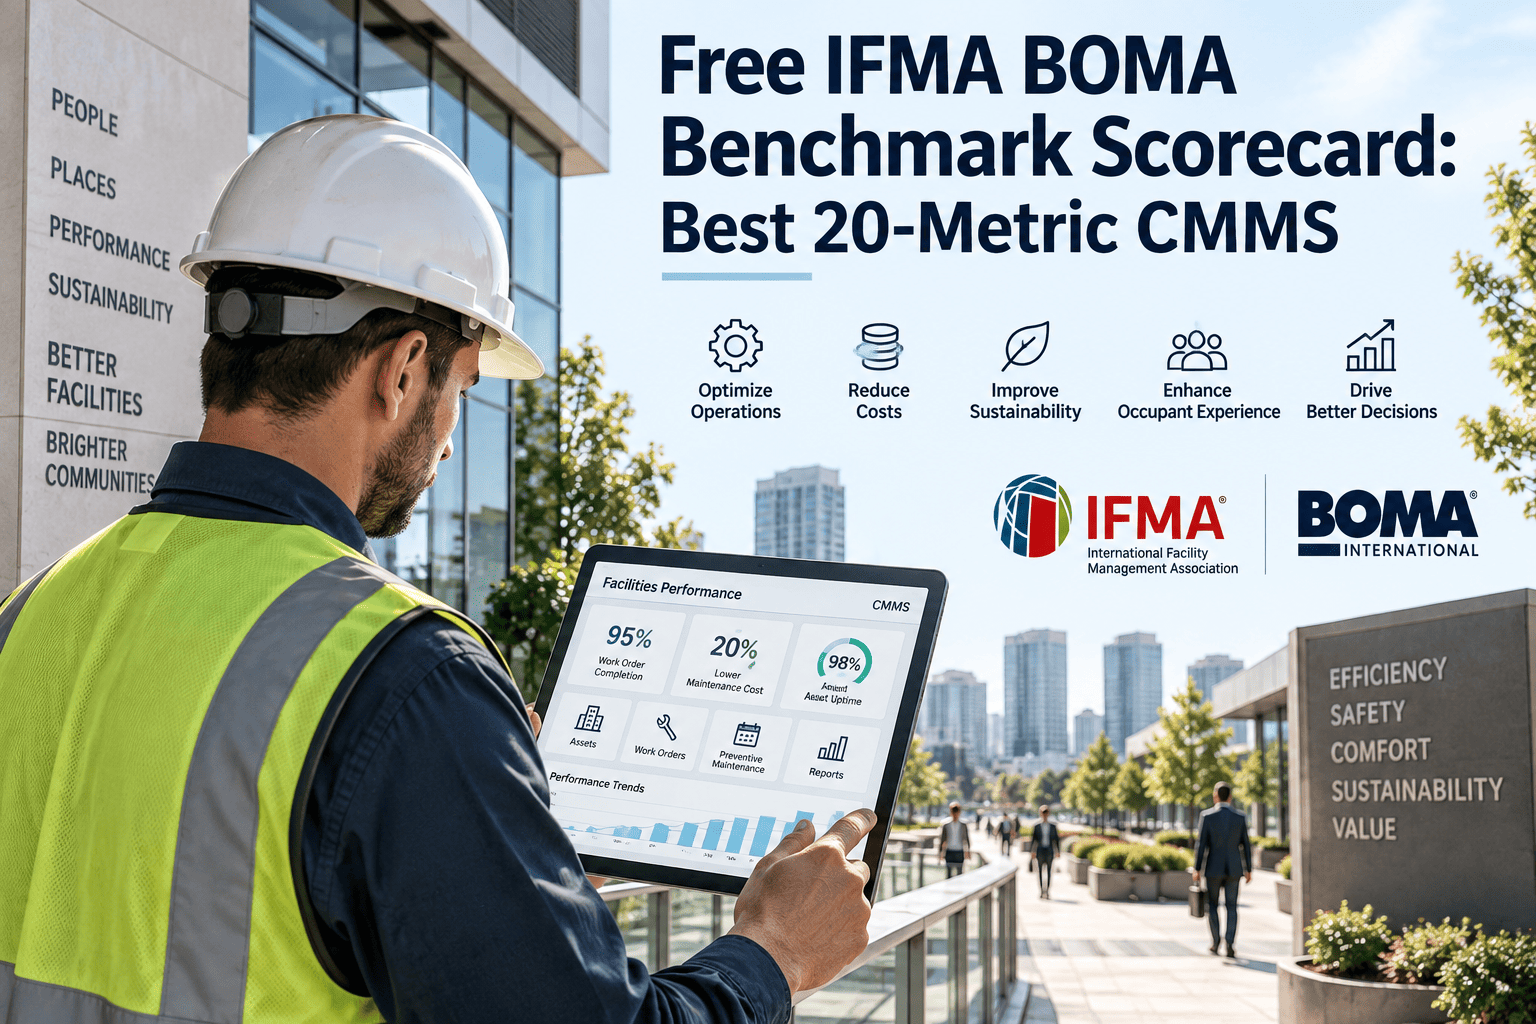
Most facility teams can quote their maintenance budget down to the dollar, but ask them how that number compares to the IFMA industry median or the BOMA Experience Exchange benchmark for their building class, and the room goes quiet. A free IFMA BOMA benchmark scorecard closes that gap by translating raw CMMS data into twenty industry-recognized metrics, so budget conversations run on comparison instead of guesswork. This guide breaks down every metric top-quartile facility operations track, and shows how a CMMS platform like OxMaint can auto-populate the scorecard from your existing work order history.
Where does your facility actually rank against IFMA and BOMA benchmarks?
Bottom-quartile facility operations spend roughly 1.8x more per square foot than top-quartile portfolios managing comparable buildings — yet most teams have no structured way to see which side of that line they sit on. This scorecard organizes the twenty metrics IFMA and BOMA use to grade FM performance, and shows how a connected CMMS keeps every number current without a quarterly data-pull project.
The real reason most facility teams can't benchmark themselves
IFMA and BOMA publish detailed annual datasets on cost per square foot, PM compliance, and energy intensity across thousands of buildings. The problem isn't access to the data — it's that most facility teams cannot produce their own numbers in a comparable format.
The stakes are rising, not falling
Global facility management spend has climbed well past the trillion-dollar mark, and boards increasingly expect operations leaders to defend that spend with the same rigor as any other capital line item. A scorecard only works, though, if the underlying numbers are trustworthy — and that is where most benchmarking initiatives quietly stall before they ever reach a board deck. Operating costs across commercial real estate have also been climbing at a mid-single-digit pace year over year, which makes the case for a repeatable benchmarking process stronger every budget cycle, not weaker.
Inconsistent data capture
Work orders logged on paper, in email threads, or in disconnected spreadsheets across sites make it impossible to calculate a single, defensible cost-per-square-foot figure.
No baseline to compare against
Teams know their own historical spend but have never mapped it against the IFMA industry median or the relevant BOMA building-class tier, so "is this good?" has no answer.
Metrics calculated once a year
Manual benchmarking is treated as an annual reporting exercise rather than a live dashboard, so problems compound for months before anyone notices the drift.
IFMA vs. BOMA: what each dataset actually measures
Facility teams often treat "IFMA benchmarks" and "BOMA benchmarks" as interchangeable, but the two organizations survey different populations and report different metric families. A useful scorecard pulls from both.
| Coverage Area | IFMA Benchmark Focus | BOMA Benchmark Focus |
|---|---|---|
| Primary dataset | FM Benchmark Report, surveying operations and maintenance practice across facility types | Experience Exchange Report, surveying commercial office and industrial building operating expenses |
| Cost metrics | Maintenance cost as a percent of current replacement value | Operating cost per square foot, broken out by building class |
| Maintenance metrics | PM compliance rate, reactive work order ratio, contractor SLA compliance | Limited maintenance-specific detail; stronger on total occupancy cost |
| Building segmentation | By facility type — office, industrial, healthcare, education, government | By building class — Class A, B, C commercial office; suburban vs. downtown |
| Best used for | Maintenance program maturity and workforce productivity comparisons | Operating budget defense and capital planning against peer properties |
Neither dataset alone gives a complete picture. IFMA's survey base leans toward maintenance practice and workforce productivity across a wide range of facility types, while BOMA's Experience Exchange Report is built almost entirely from commercial office and industrial operating expense data segmented by building class. A scorecard that pulls cost benchmarks from BOMA and maintenance-practice benchmarks from IFMA gives a more complete comparison than relying on either source alone.
The 20-metric IFMA + BOMA benchmark scorecard
These twenty metrics span four categories facility leaders are expected to report on today: cost and financial performance, maintenance effectiveness, energy and sustainability, and service quality. Each row below is a metric you can pull directly from CMMS work order, asset, and cost data.
Cost & Financial Performance
These five metrics are the ones finance and board stakeholders reference most often, since each maps directly to a line item in the operating budget.
Maintenance Effectiveness
This group explains why the cost figures above look the way they do — a low PM compliance rate almost always shows up later as an elevated reactive cost ratio.
Energy & Sustainability
Increasingly reported alongside financial metrics as ESG disclosure requirements tighten, these figures now feed directly into investor and board-level sustainability reporting.
Service Quality & Compliance
The metrics least likely to appear in a spreadsheet but most likely to surface in an audit finding or a tenant complaint if left untracked.
Get your own 20-metric scorecard populated from live data
See exactly where your facility sits against IFMA and BOMA benchmarks — without a manual data pull.
How to calculate your benchmark gap
Once you have your own numbers for all twenty metrics, the scorecard becomes useful the moment you calculate the gap against the relevant IFMA median or BOMA tier — not just the raw figure itself.
A facility spending $11.40/SF against a BOMA Class A median of $9.80/SF is running roughly 16% over benchmark — a number that justifies a maintenance program review long before the annual budget cycle.
Worked example: A 12-building commercial portfolio ran its first OxMaint-generated scorecard and found a 71% PM compliance rate against an IFMA median near 85%, alongside a reactive work order ratio of 41%. After six months of CMMS-driven preventive scheduling, PM compliance rose to 88% and the reactive ratio dropped to 22%, moving the portfolio's cost per square foot from roughly 14% above the BOMA Class B median to within 3%.
When does a gap actually require action?
A 3% variance from benchmark is usually well within normal seasonal or occupancy-driven fluctuation. A variance past roughly 10 to 15%, sustained for more than one reporting cycle, consistently signals a structural issue worth investigating — an aging asset class, an understaffed maintenance team, or a contractor consistently missing its SLA terms.
From scorecard to action: keeping all 20 metrics current
A scorecard filled out once a year loses value within weeks. OxMaint is an AI-powered CMMS and EAM platform that keeps every metric on the scorecard current, sourced directly from the work order, asset, and cost data your team already generates — rather than exported into a separate spreadsheet each quarter.
Standardized data capture at the source
Mobile work order forms enforce consistent fields for labor hours, parts cost, and downtime across every site, so cost-per-square-foot and CRV percentages are comparable portfolio-wide.
Automated PM and reactive-ratio tracking
Preventive maintenance scheduling and completion logs feed PM compliance rate and reactive work order ratio automatically, with no manual tally at month-end.
Contractor SLA and inspection dashboards
Vendor response times and inspection completion are logged against SLA terms in real time, surfacing the 17-point gap between average and top-quartile contractor compliance before it becomes a renewal-time surprise.
Energy and asset condition reporting
Meter integrations and asset condition scoring populate the energy and sustainability tier of the scorecard, exportable in formats aligned with GHG Protocol and ISO 50001 reporting.
Four mistakes that quietly invalidate a benchmark scorecard
Building the scorecard is the easy part. Keeping it accurate over multiple reporting cycles is where most initiatives lose credibility with the people they were built to convince.
Comparing against the wrong building class
A suburban Class B office measured against a downtown Class A median will always look like it is overspending. Confirm the correct BOMA tier before drawing conclusions from a cost-per-square-foot gap.
Mixing planned and unplanned cost categories
If emergency contractor callouts get coded the same as routine PM labor, the planned-versus-reactive cost ratio becomes meaningless, and the single most actionable metric on the scorecard stops being trustworthy.
Treating the scorecard as a one-time project
A scorecard built once for a board meeting and never updated again tells you where you stood on that date, not where you stand now. Benchmarks drift, and so does performance.
Ignoring asset criticality when averaging
Blending MTBF and MTTR data across low-criticality and mission-critical assets hides the failures that matter most. Segment the scorecard by criticality tier before averaging across a portfolio.
Rolling out the scorecard across a portfolio
Facility teams managing multiple sites rarely benchmark everything at once. A phased rollout keeps the scorecard accurate while the underlying CMMS data matures.
Pilot on your highest-cost site
Import asset and cost history for one facility, populate all 20 metrics, and validate against known figures before scaling.
Standardize data fields portfolio-wide
Roll the same work order taxonomy, cost categories, and inspection checklists out to every site so cross-site comparisons hold up.
Set internal targets against IFMA/BOMA tiers
Translate each metric's industry benchmark into a facility-specific target, factoring in building age, class, and criticality.
Review the scorecard monthly, not annually
Move benchmarking from a once-a-year reporting task into a standing dashboard review, catching drift within weeks instead of a full budget cycle.
Most portfolios that follow this sequence reach a stable, trustworthy scorecard within one full quarterly cycle — fast enough to inform the next budget planning round rather than the one after it.
Frequently asked questions about the IFMA BOMA benchmark scorecard
Is the IFMA BOMA benchmark scorecard really free?
The scorecard structure and metric definitions in this guide are free to use. IFMA and BOMA's full underlying survey reports are typically sold to non-members, but the benchmark ranges summarized here give you a working comparison point without purchasing either report.
How often should we update our scorecard numbers?
Monthly at minimum for cost and maintenance-effectiveness metrics, since those shift quickly. Energy and sustainability metrics can be reviewed quarterly. A connected CMMS like OxMaint updates all twenty automatically as work orders close.
Do small facility teams need all 20 metrics?
Start with the five cost and five maintenance-effectiveness metrics first — they drive the majority of budget conversations. Energy and service-quality metrics can be added once basic PM and cost tracking is consistent.
Can OxMaint pull our historical data into the scorecard?
Yes. Asset registers, past work orders, and cost history can be imported during onboarding, so your first scorecard reflects real trailing performance rather than starting from zero. You can Get Started to begin an import.
How is this different from a generic facility KPI dashboard?
A generic KPI dashboard shows your own numbers in isolation. This scorecard pairs each metric with the relevant IFMA or BOMA industry benchmark, so every figure comes with a comparison point built in.
Making the scorecard part of how you operate, not just how you report
The facility teams that get the most value from this scorecard treat it as an operating tool rather than a once-a-year artifact for a board deck. Reviewed monthly alongside work order data, the twenty metrics surface the same early warning signs that IFMA and BOMA researchers see repeat across thousands of buildings — rising reactive ratios, slipping SLA compliance, and cost creep that outpaces occupancy growth — often months before they would otherwise show up in an annual budget variance report.
Turn 20 months of guesswork into one live scorecard
Book a walkthrough and see your facility's IFMA and BOMA benchmark gaps calculated from your own CMMS data.
Free 14-day trial · No credit card