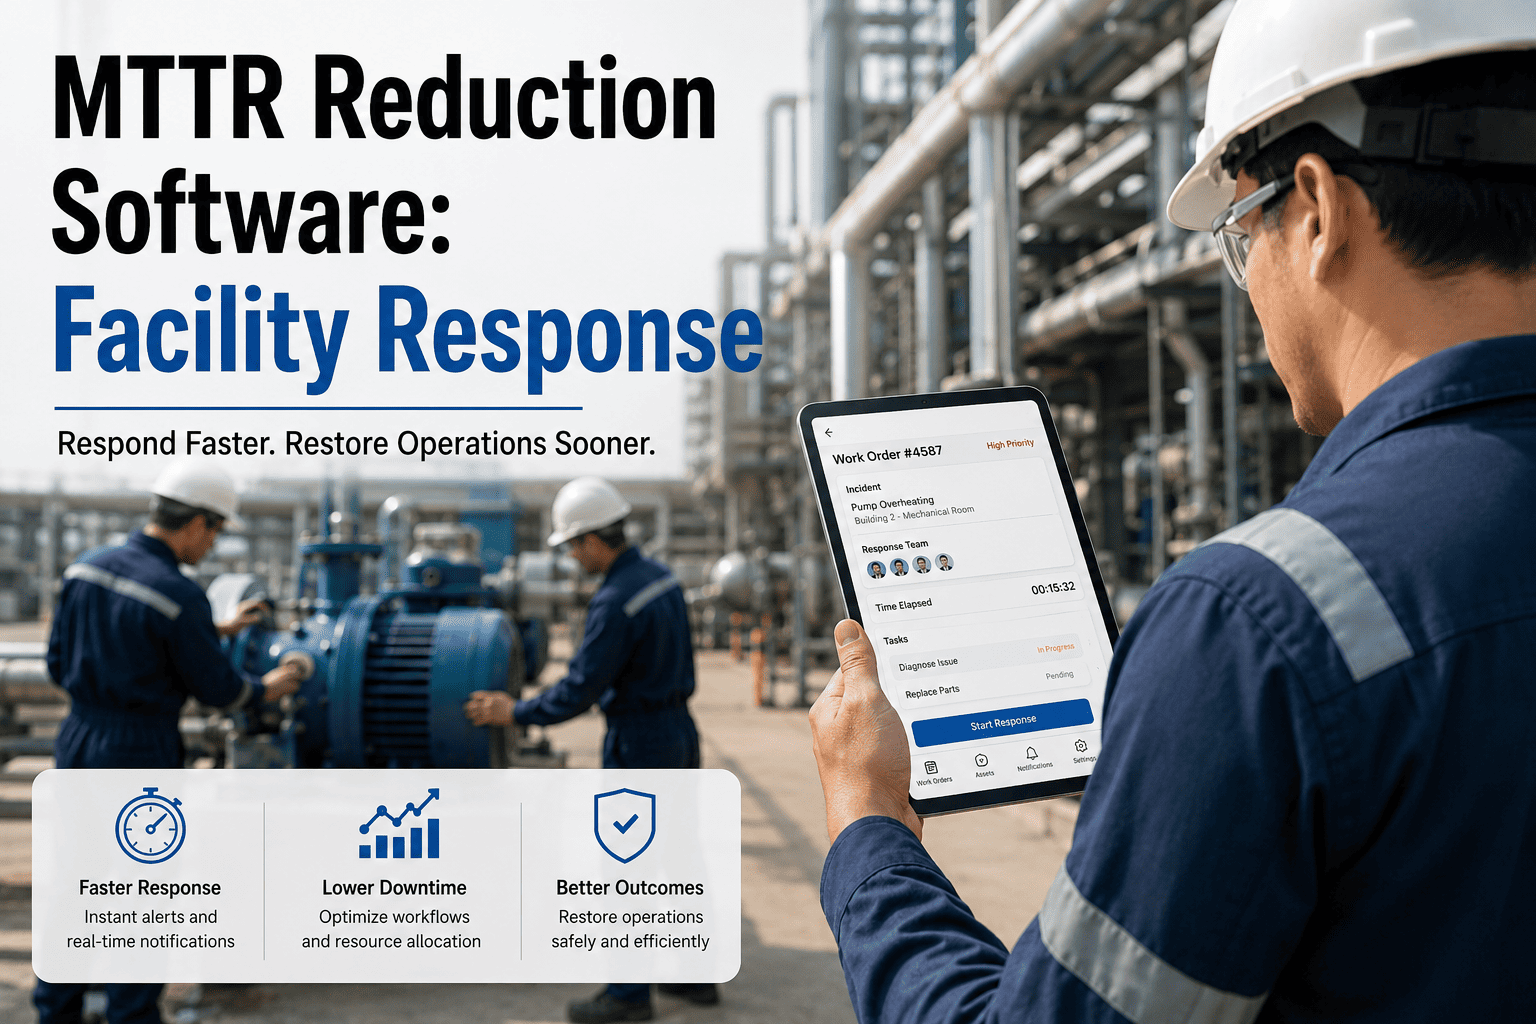
MTTR reduction software is the fastest lever facility engineering leaders have to defend headcount, coverage, and uptime in 2026 — and the best MTTR CMMS platforms prove it with response-time data, not anecdotes. Mean Time To Repair is the metric that separates reactive firefighting from a controlled, auditable maintenance operation. This guide breaks down what a top MTTR platform actually does, the benchmarks that matter, and how facilities cut MTTR 30–50% within months of switching from spreadsheets and paper logs. If you're evaluating a facility MTTR CMMS, Start Free Trial and see your own numbers move in weeks, not quarters.
What If Your Facility Could Prove — With Data — That Every Minute of Downtime Is Being Attacked?
The average facility loses $125,000 per hour of unplanned downtime. A top MTTR CMMS gives you the response-time visibility, automated workflows, and audit-ready reports to shrink that number — and defend your team's budget with hard evidence.
Why MTTR Is the Metric Facility Directors Can't Afford to Ignore
Every unplanned equipment failure triggers a cascade: production stops, occupants complain, overtime spikes, and leadership asks why. Facilities running reactive maintenance average 4–8 hours MTTR on critical assets. Best-in-class operations using MTTR reduction software hold that number under 90 minutes — and they can prove it with timestamped work-order data, not estimates.
5 Capabilities That Separate a Top MTTR Platform From a Digital Filing Cabinet
Not every CMMS reduces MTTR. Many just digitize the same broken process. The best MTTR software for facilities in 2026 attacks every phase of the repair cycle — detection, dispatch, diagnosis, repair, and verification — with automation and real-time data.
When a fault is reported — by a technician, an IoT sensor, or a tenant portal — the system auto-generates a prioritized work order and routes it to the nearest qualified technician in seconds. No phone tag, no lost paper tickets. Facilities using automated dispatch cut response time (the "M" in MTTR) by 40–60% alone.
Technicians receive push notifications, scan asset QR codes on-site, access repair history and manuals from their phone, and close work orders with photos and timestamps. Eliminating trips back to the office for paperwork shaves 20–30 minutes off every repair.
Every repair is logged against the asset, building a searchable failure history. When the same HVAC unit fails for the third time in a quarter, the platform flags it for root-cause analysis — so you fix the cause, not the symptom. Facilities that run structured RCA reduce repeat failures by 25–35%.
A technician who arrives on-site without the right part doubles the repair time. Top MTTR CMMS platforms link work orders to parts inventory, auto-check stock levels, and trigger reorder alerts — eliminating the "waiting on parts" dead time that inflates MTTR by hours.
Facility directors and VPs get live dashboards showing MTTR by asset class, technician, building, and time period — plus one-click reports formatted for OSHA, NFPA, ISO 55000, and internal reliability audits. This is the data that defends headcount and justifies budget.
How to Calculate MTTR — and What "Good" Looks Like for Facilities in 2026
MTTR = Total Repair Time ÷ Number of Repairs. Simple formula, but the insight is in the segmentation. A facility-wide average hides the truth: your chiller MTTR might be 2 hours while your elevator MTTR is 14. The best MTTR platforms break it down by asset type, priority, location, and technician so you know exactly where to intervene.
Track it weekly, monthly, and quarterly. Segment by asset criticality, building, and team. A top MTTR CMMS calculates this automatically from work-order timestamps — no manual math.
| Asset Category | Reactive Facility MTTR | CMMS-Enabled MTTR | Best-in-Class Target |
|---|---|---|---|
| HVAC / Chiller Systems | 6–10 hours | 2–3 hours | <90 minutes |
| Electrical / Switchgear | 4–8 hours | 1.5–2.5 hours | <60 minutes |
| Plumbing / Hydraulics | 3–6 hours | 1–2 hours | <45 minutes |
| Elevators / Conveyance | 8–24 hours | 4–6 hours | <3 hours |
| Production / Critical Equipment | 4–12 hours | 1.5–3 hours | <60 minutes |
The gap between "reactive" and "CMMS-enabled" isn't marginal — it's 3–5x. And the gap between CMMS-enabled and best-in-class is where predictive maintenance and IoT sensor integration close the loop, catching failures before they happen.
How a 200-Asset Facility Cut MTTR From 5.2 Hours to 1.8 Hours in 4 Months
A regional healthcare campus with 200 tracked assets — HVAC, electrical, plumbing, and life-safety systems — was running on paper work orders and tribal knowledge. Average MTTR: 5.2 hours. Unplanned downtime cost: roughly $38,000 per month. The facility engineering manager had no data to justify adding a third technician.
- Paper work orders lost or delayed 2–3 hours
- No asset history — every repair started from zero
- Parts runs added 45–90 minutes per job
- Zero visibility for leadership; headcount requests denied
- Auto-dispatch cut response time to under 10 minutes
- QR-code asset lookup gave instant repair history
- Parts pre-staged from linked inventory
- MTTR dashboard justified 1 additional hire — approved
Result: 65% MTTR reduction, $24,700/month in avoided downtime cost, and — for the first time — a data-backed case for headcount that leadership approved in one meeting. That's what a facility MTTR CMMS delivers when it's built for the way maintenance teams actually work.
Why OxMaint Is the Best MTTR CMMS for Facility Teams in 2026
OxMaint isn't a generic CMMS retrofitted for facilities — it's purpose-built MTTR reduction software that combines AI-powered work orders, preventive maintenance scheduling, asset lifecycle tracking, and compliance-grade reporting in one platform your technicians will actually use.
Auto-generate, prioritize, and dispatch work orders from sensor alerts, tenant requests, or scheduled PMs. Technicians get push notifications with asset history, manuals, and parts lists — cutting response time by up to 60%.
Schedule recurring PMs by calendar, meter reading, or IoT sensor threshold. OxMaint's AI flags assets trending toward failure so you fix them on your schedule — not during a breakdown. Facilities see 30–50% less unplanned downtime.
Every asset gets a QR-coded digital profile with full repair history, warranty status, and linked parts inventory. Technicians scan, diagnose, and repair without leaving the field — eliminating the parts-run delays that inflate MTTR.
Live dashboards show MTTR, MTBF, downtime cost, and PM compliance by asset, team, and building. One-click exports formatted for OSHA, NFPA, ISO 55000, and internal audits — the data facility leaders need to defend budgets and headcount.
See Your Facility's MTTR Drop — Book a 30-Minute Demo
We'll load your asset types, walk your team through the mobile workflow, and show you the MTTR dashboard with your own data model. No generic slides — your facility, your numbers.
MTTR Software for Facilities: Your Questions Answered
MTTR (Mean Time To Repair) measures the average time from when an asset fails to when it's fully operational again. For facility teams, it's the single best indicator of maintenance efficiency — high MTTR means reactive chaos, low MTTR means controlled, data-driven operations. Leadership uses MTTR trends to evaluate team performance and justify budget.
Facilities deploying a modern CMMS with mobile work orders and automated dispatch typically see 30–50% MTTR reduction within 6 months. The biggest gains come from eliminating response delays (auto-dispatch), diagnosis time (asset history at your fingertips), and parts delays (integrated inventory). Start Free Trial and measure your own baseline in the first week.
MTTR measures how fast you repair; MTBF (Mean Time Between Failures) measures how often things break. Both matter: MTTR tells you how efficient your response is, MTBF tells you how reliable your assets are. A top MTTR platform tracks both — and uses MTBF trends to trigger preventive maintenance before failures occur, reducing the number of repairs you need to respond to.
Yes — this is one of the most powerful use cases. When you can show leadership a dashboard proving that MTTR spikes correlate with understaffed shifts, or that adding one technician would cut downtime cost by $15K/month, the conversation changes from "why do you need more people?" to "how fast can we hire?" OxMaint's reporting is built for exactly this.
Most facilities are live on OxMaint within 1–2 weeks — asset import, PM schedule setup, and technician onboarding included. Measurable MTTR improvement typically appears within 30–60 days as work orders flow through the system and response times drop. Book a Demo and we'll map your implementation timeline on the call.
Stop Guessing. Start Measuring. Cut Your MTTR.
Join facilities worldwide using OxMaint to reduce downtime, defend budgets, and prove maintenance value with data. Your first MTTR report is one demo away.





