Most facility teams believe their preventive maintenance program is further along than it actually is. A maintenance manager points to a CMMS loaded with PM schedules and calls the operation "proactive," while technicians still spend most of the week chasing breakdowns that were never on any schedule at all. Industry assessments consistently find a wide gap between where teams think they stand and where they actually stand — the number one reason PM programs stall for years without improving. The five-level PM maturity model closes that gap by giving facility teams an honest, measurable benchmark, from reactive firefighting all the way to fully prescriptive, AI-guided maintenance. Curious where your facility really ranks and what closing the gap is worth in avoided downtime? Start a free trial with Oxmaint to run a real PM maturity assessment against your own asset and work order data.
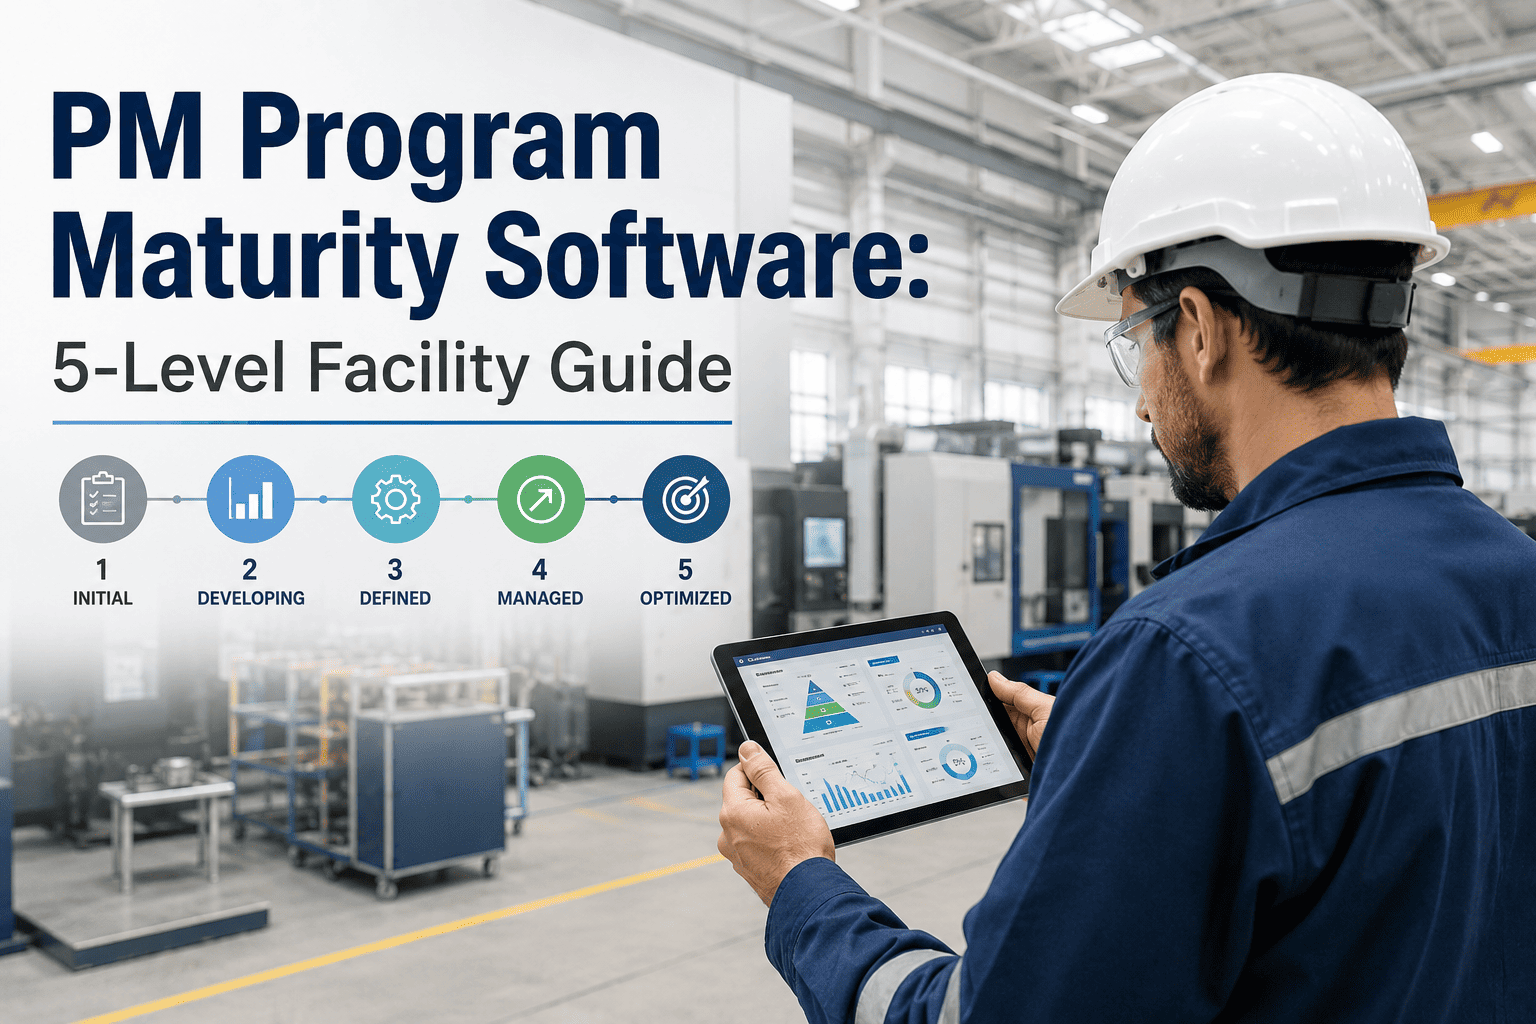
PM Program Maturity Software: The 5-Level Facility Guide
A practical benchmark for facility engineering and reliability teams — see exactly what separates reactive firefighting from world-class, prescriptive maintenance, and what a CMMS needs to support at every stage.
Why Your Facility Might Be a Full Level Lower Than You Think
A recent industry survey found that most maintenance leaders overestimate their own program. Teams at Level 1 usually describe themselves as Level 2 because a PM schedule exists somewhere inside the CMMS. Teams at Level 2 describe themselves as Level 3 because a handful of assets carry condition monitoring sensors. The pattern repeats at every stage, and the confusion is understandable — having a capability and consistently executing on it are two very different things.
A PM schedule that technicians reroute around every time a real emergency comes in is not a functioning Level 2 program, it is a Level 1 program with a spreadsheet attached. This is exactly why an honest maturity assessment matters more than another software purchase. Before adding sensors, analytics, or AI layers, a facility needs to know its true starting point, because each level depends entirely on the discipline built at the one before it.
The 5 Levels of PM Program Maturity
Rooted in the maintenance maturity model refined over two decades of SMRP and ISO 55000 asset management practice, each level represents a fundamentally different way of running maintenance — not just a new tool, but a new operating model for how work gets planned, executed, and measured.
Equipment runs until it fails, and the team responds. PM schedules may exist on paper, but reactive emergencies constantly displace planned work, so compliance stays low. Asset history lives in people's heads rather than in any system, and average asset life falls to roughly 60–70% of its design potential.
A CMMS is in place with calendar- and meter-based PM schedules, and planned work finally overtakes reactive firefighting on the tier-one fleet. Work orders are kitted with the right parts and scheduled ahead of time, though PM compliance on lower-priority assets often still lags well behind top-tier equipment.
Real-time sensor data — vibration, temperature, pressure — starts triggering maintenance instead of the calendar alone. This level is impossible without mobile access for technicians, since alerts and inspection data need to reach the floor in real time, not at the next desktop login.
Data analytics and machine learning forecast failures before they happen. Maintenance planning now weighs asset criticality and full lifecycle cost, not just the next due date. One pulp and paper mill integrating vibration sensors with its CMMS cut catastrophic motor failures by roughly 40% at this stage.
The CMMS becomes the command center for enterprise asset management, and decisions turn prescriptive — the system recommends the action and the reasoning behind it. AI and machine learning continuously refine schedules, inventory, and workforce allocation, sustaining world-class OEE and the lowest maintenance cost per operating hour in the model.
Find Out Your Facility's Real PM Maturity Level
Most self-assessments are off by a full level. Oxmaint benchmarks your actual work order data, PM compliance, and asset history against the five-level model — no guesswork.
What Climbing Each Level Is Actually Worth
Maturity gains compound. The jump from Level 1 to Level 2 pays for itself almost immediately just from centralizing work orders, while the leap from Level 4 to Level 5 delivers the largest return of all on the assets that matter most to uptime.
| Transition | What Changes Operationally | Typical Benchmark |
|---|---|---|
| L1 → L2 | Work orders centralized, calendar/meter PM schedules deployed | 12–18% maintenance cost reduction |
| L2 → L3 | Mobile access rolled out, condition sensors added to critical assets | Additional 18–25% cost reduction |
| L3 → L4 | SCADA, ERP, and IoT data integrated for failure forecasting | 10–20% more cost savings, 30–50% less downtime |
| L4 → L5 | AI/ML prescribes actions across schedules, inventory, and labor | 10–30x ROI on high-criticality assets |
What Your CMMS Needs to Support at Each Stage
The minimum bar for Level 3. Without a mobile app that reaches technicians on the floor, condition alerts sit unread and adoption stalls before condition-based maintenance ever gets a fair chance.
Essential for Level 4. Predictive models are only as good as the data feeding them, and that means pulling SCADA, ERP, and IoT sensor streams into one connected picture of every asset.
Required for Level 5. A platform without machine learning caps out at reporting on what already happened — it can never prescribe the next best action across schedules, parts, and labor.
Choosing a platform that already supports your target maturity level prevents the painful mid-journey migration that catches most facilities right at the Level 3-to-4 transition, when their original CMMS simply cannot integrate the data sources predictive maintenance depends on.
Reactive Facility vs. Data-Driven Facility
See Your Facility's Maturity Roadmap
Oxmaint maps your current PM compliance, asset criticality, and data sources to the exact next level — with a step-by-step plan to get there without a painful platform migration.
Built to Move Facilities Up the Maturity Model, Step by Step
Calendar and meter-based schedules with live compliance dashboards, so gaps between planned and completed PM work are visible before they turn into breakdowns.
Full mobile access for the field team, closing the gap that stalls most facilities at Level 2 and unlocking real-time response to condition-based alerts.
Connect vibration, temperature, and pressure sensors directly to asset records, turning raw sensor noise into triggered work orders automatically.
SCADA, ERP, and IoT data unified into one view, surfacing failure forecasts and criticality-weighted priorities for planners and reliability engineers.
Every asset scored by criticality and tracked across its full lifecycle, so maintenance dollars go where downtime risk is highest, not just where the alarm is loudest.
Reporting built for OSHA, NFPA, and ISO 55000 requirements, generated automatically from the same data that drives day-to-day maintenance decisions.
What Facilities See After Closing the Maturity Gap
Common Questions About PM Program Maturity
What exactly is a PM program maturity model?
It is a five-level benchmark — reactive, preventive, condition-based, predictive, and prescriptive — that measures how a facility actually plans, executes, and improves maintenance, not just what tools it owns. Start a free trial to benchmark your own program.
How do I know what level my facility is actually at, not what I think it is?
Look at your planned-versus-reactive work ratio and PM compliance on tier-one assets rather than whether a schedule simply exists. Most teams overestimate by a full level until they check the real numbers.
What CMMS capability is required to move from Level 2 to Level 3?
Mobile access for technicians is the minimum requirement, since condition-based alerts are only useful if the field team receives and acts on them in real time rather than at the next desktop login.
How much can moving up one maturity level actually save?
Benchmarks range from 12–18% cost reduction moving out of Level 1 to as much as 10–30x ROI on critical assets at full Level 5 maturity, depending on where a facility starts.
Can a facility skip levels instead of progressing through each one?
Rarely with lasting results — each level builds the data discipline and culture the next one depends on. Book a demo to see a realistic step-by-step roadmap for your facility.
Know Your Level. Know the Next Step. Start Closing the Gap Today.
Oxmaint benchmarks your facility against the five-level PM maturity model using your own work order and asset data, then maps the exact next step to get there — without a painful platform migration down the road.





