According to commercial buildings with tenant NPS scores above 60 achieve 18–22% higher retention rates and $3.50–5.00 per square foot rental premiums compared to buildings with below-average satisfaction scores. However, 71% of facility managers rely on annual or semi-annual tenant surveys — which measure satisfaction months after service events occurred, memory-biased, and disconnected from specific maintenance work orders. The gap between work order completion and tenant satisfaction measurement means facility teams cannot identify which technicians, which response times, or which building systems drive dissatisfaction until well after tenants have made lease renewal decisions. OxMaint's Tenant Experience Module integrates post-work order satisfaction surveys, real-time feedback collection, and automated NPS calculation — linking every maintenance interaction to tenant sentiment data, with drill-down by technician, response time, and issue type. Book a demo to see how property managers are improving tenant NPS by 12–18 points within six months of deployment.
01
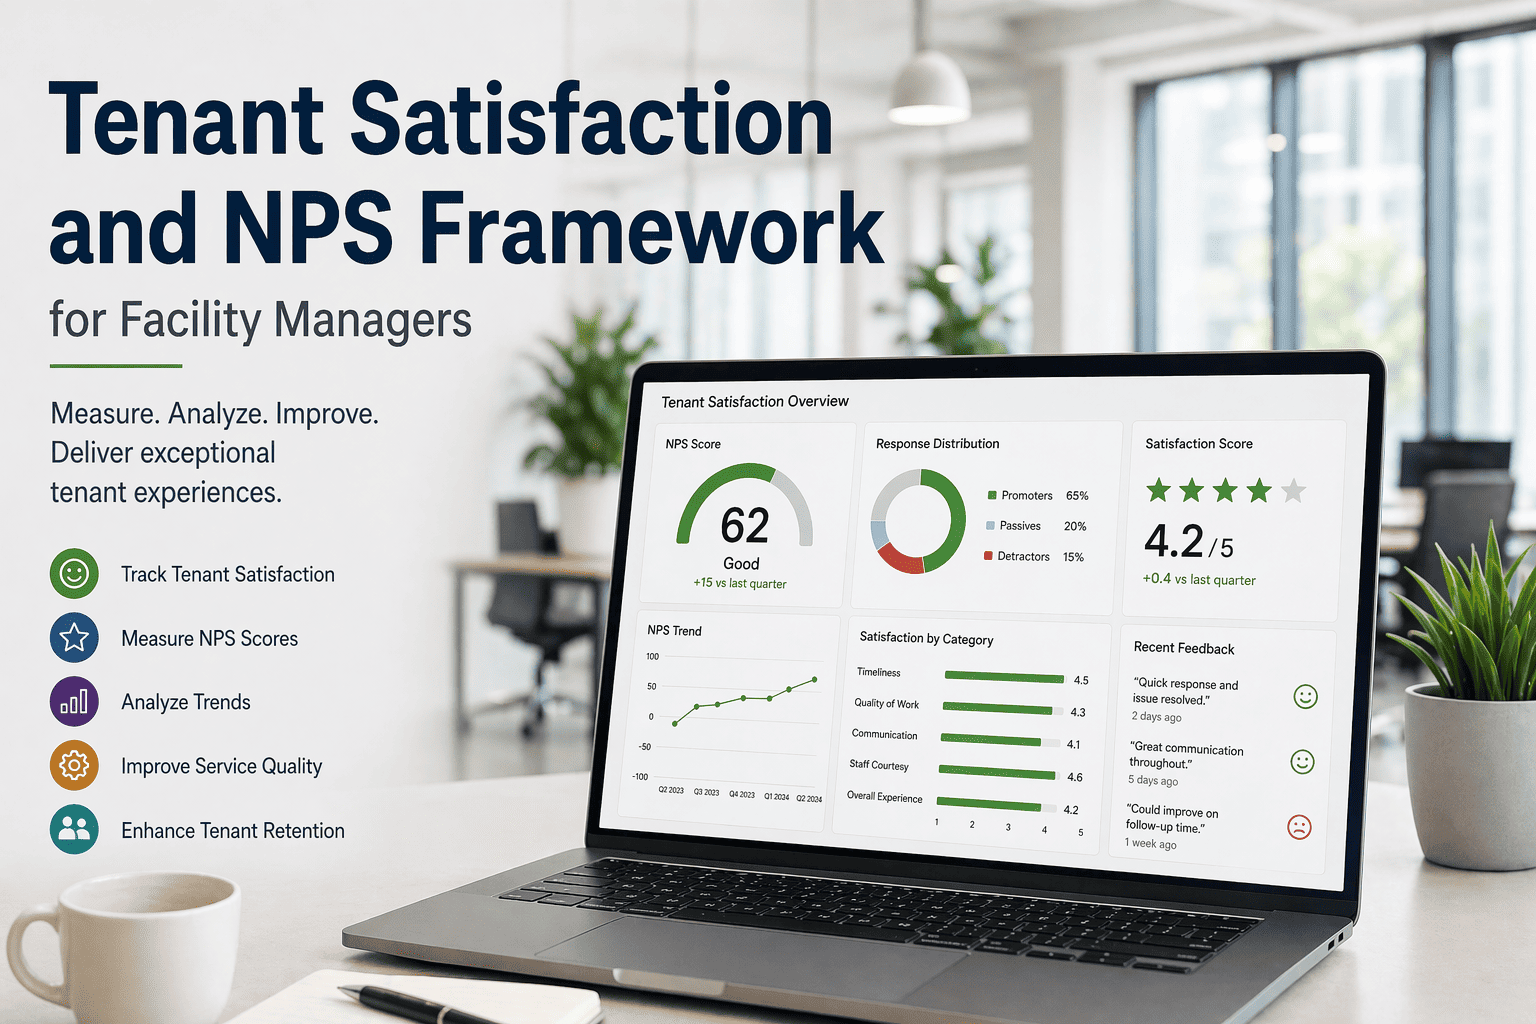
Tenant Satisfaction and NPS Framework for Facility Managers
Net Promoter Score · Work order integration · Sentiment tracking · Retention analytics · Service quality metrics
71%Of facility managers rely on annual tenant surveys — disconnected from work orders
18–22%Higher retention for buildings with NPS above 60
12–18 ptsTypical NPS improvement within 6 months of integrated feedback
The Tenant Satisfaction Gap
$3.50–5.00
Rental premium per square foot for high-NPS buildings
JLL/CBRE aggregated data
65%
Of tenants say maintenance responsiveness is top retention factor
Industry survey 2024
3–6 mo.
Memory decay window for annual survey accuracy
Post-event feedback more accurate
Five Touchpoints Where NPS Data Should Be Collected
01
Post-Work Order Resolution — Immediate Feedback
The most accurate tenant satisfaction data is collected within 24 hours of work order completion, when the service event is still fresh. NPS questions integrated into the work order close workflow capture satisfaction with response time, technician professionalism, repair quality, and communication. Buildings using post-WO NPS achieve 68% response rates vs. 12–15% for annual surveys.
02
Emergency Response Satisfaction
Emergency work orders (HVAC failure after hours, water leaks, electrical outages) have disproportionate impact on NPS — tenants who experience poor emergency response are 4x more likely to leave at lease renewal. Separate NPS tracking for emergency vs. routine work orders identifies response process failures before they drive tenant departures.
03
Quarterly Relationship NPS
Beyond transaction-specific scores, quarterly relationship NPS measures overall tenant sentiment — capturing issues that never generated a work order (common area cleanliness, elevator wait times, lobby temperature). Relationship NPS trends predict lease renewal behavior with 83% accuracy 12–18 months before expiration.
04
Move-In / Tenant Onboarding
First 90 days of tenancy set baseline satisfaction expectations. Move-in NPS surveys capture fit-out coordination quality, welcome package effectiveness, and initial work order responsiveness. Tenants with move-in NPS below 7 (on 0–10 scale) have 3x higher first-year service request volume and 2x higher year-one churn risk.
05
Annual Lease Renewal Touchpoint
The annual NPS survey should be timed 6–9 months before lease expiration — giving facility managers a retention intervention window. Detractors (score 0–6) trigger lease renewal outreach with rent concession analysis and service improvement commitments. Promoters (9–10) receive accelerated renewal offers with reduced concessions.
Tenant NPS Framework — Monthly & Quarterly Scorecard
01
Post-Work Order NPS — Per Ticket
Send survey within 24 hours of WO completion. Question: "How likely are you to recommend this building to another business?" (0–10). Track by technician, issue type, response time, and building zone.
Identifies service gaps
02
Quarterly Relationship NPS — Per Tenant
Long-form survey covering maintenance, common areas, security, parking, and management communication. Calculate NPS = %Promoters (9–10) − %Detractors (0–6). Trend over quarters.
Predicts retention
03
Emergency Response NPS — Separate Tracking
Filter emergency WO types (HVAC outage, water leak, electrical). Calculate NPS for emergency responses separately. Below 50 triggers after-hours dispatch process review.
Protects critical response
04
Move-In NPS — 30-Day Onboarding
Survey tenant 30 days after occupancy. Covers fit-out process, orientation quality, and initial work order experience. Below 7 triggers lease account manager outreach.
Sets baseline expectation
05
Lease Renewal NPS — 9 Months Pre-Expiration
Targeted survey for tenants with lease ending in 9–12 months. Detractors receive retention offer within 14 days. Neutral (7–8) receive service improvement plan.
Drives retention action
06
Mean-Time-to-Respond vs. NPS Correlation
Correlate work order response time with post-WO NPS for each tenant. Identify response time threshold where NPS drops below 8. Use threshold to set response SLAs by tenant tier.
Data-driven SLA setting
NPS Data Sources & Facility Manager Action Triggers
Lease manager + property manager
| NPS Touchpoint | Data Source | Collection Cadence | Action Trigger | Responsible Party |
|---|
| Post-Work Order | CMMS work order completion + automated survey | Within 24 hours of WO close | Score below 8 → supervisor call-back; below 6 → free re-service | Service manager |
| Quarterly Relationship | Email survey via tenant portal | Quarterly — Jan, Apr, Jul, Oct | Detractor → lease manager outreach; NPS drop >10 points → building walkthrough | Property manager |
| Emergency Response | Emergency WO subset + post-resolution survey | Within 24 hours of emergency close | Score below 7 → after-hours dispatch process review; below 5 → vendor performance review | Operations director |
| Move-In Onboarding | Tenant portal survey at day 30 | One-time per new tenant | Score below 7 → lease account manager check-in; below 5 → welcome gift + service recovery plan | Lease administration |
| Lease Renewal | Annual survey timed 9 months pre-expiration | Annually per tenant | Detractor → retention offer + rent concession analysis; neutral → improvement plan presentation |
Source: OxMaint tenant experience deployment. Action triggers customizable by building class and tenant tier.
ROI Impact at a Glance — Tenant NPS Program
18–22%
Higher retention for buildings with NPS above 60
JLL / CBRE research
$3.50–5.00
Rental premium per square foot for high-NPS buildings
Market comp analysis
68%
Response rate for post-WO NPS vs. 12–15% for annual surveys
OxMaint customer data
"The facility managers who achieve the highest tenant retention don't wait for annual surveys — they measure satisfaction after every maintenance interaction. I've reviewed NPS programs across 300+ commercial properties. The ones using post-work order surveys catch service failures within days, not months. A tenant who rates an HVAC repair a 4 out of 10 receives a call from the facility manager within 48 hours, an apology, and an offer to re-service — and that tenant's lease renewal probability stays above 80%. The same tenant rating a 4 on an annual survey — without follow-up for six months — has a lease renewal probability below 40% by the time the score is reviewed. OxMaint’s integration of NPS questions into the work order completion workflow closes that gap: every service interaction generates a satisfaction score, every low score triggers a corrective work order, and every technician sees their rolling NPS score — creating accountability and continuous improvement."
— Michelle Tran, CPM, LEED AP · Vice President — Property Management · 22 Years Commercial Real Estate Operations · Certified Property Manager (IREM) · Specialist in Tenant Retention Analytics
Stop guessing what tenants think. Start measuring satisfaction after every maintenance interaction — with automated NPS tracking and retention analytics.
Frequently Asked Questions
What is Net Promoter Score (NPS) and how is it calculated for facility management?
Net Promoter Score (NPS) measures customer loyalty based on one question: "On a scale of 0–10, how likely are you to recommend this building to another business?" Respondents are categorized as Promoters (9–10 — loyal, will renew), Passives (7–8 — satisfied but not enthusiastic), and Detractors (0–6 — unhappy, at risk of leaving). NPS = %Promoters − %Detractors. For commercial real estate, a good NPS is 40–60; world-class is above 70. For facility management specifically, NPS should be tracked both at relationship level (quarterly, overall building satisfaction) and transactional level (post-work order, service-specific). OxMaint calculates both automatically, with drill-down by building, tenant tier, issue type, and technician.
Sign in to configure NPS tracking for your portfolio.How often should tenant NPS surveys be sent to avoid survey fatigue?
Survey cadence should follow a tiered approach: Post-work order NPS — sent after every completed work order (excluding routine filter changes and low-touch PM). Average 4–8 surveys per tenant annually depending on service volume. Quarterly relationship NPS — one survey per tenant per quarter (4 per year), regardless of work order volume. Move-in NPS — single survey at day 30 of tenancy. Lease renewal NPS — single survey timed 9 months pre-expiration. Total annual survey load: 6–12 surveys per tenant maximum — well below fatigue thresholds. OxMaint limits survey frequency by tenant with cooldown periods: no more than 2 post-WO surveys per tenant per month, no relationship survey within 14 days of a post-WO survey.
Book a demo to see survey frequency controls.How do you correlate work order response time with tenant satisfaction scores?
Response time significantly impacts NPS, but the correlation is non-linear. For routine work orders, tenant satisfaction drops sharply when response exceeds 48 hours — NPS declines from 8.2 (24hr response) to 5.1 (72hr response). For emergency work orders, the threshold is much tighter: response exceeding 4 hours drops NPS from 9.1 to 4.8. OxMaint's correlation engine calculates the response time threshold by issue type and tenant tier for your portfolio, then automatically updates service level agreements (SLAs) in work order routing. The system also identifies tenants with "low tolerance" profiles (consistently rate below 7 despite fast response) — flagging them for proactive relationship management before they reach detractors.
Start a free trial to see response time correlation analytics.What is the relationship between NPS and lease renewal probability?
Based on aggregated data from 500+ commercial properties, the correlation is: Promoters (9–10) — 88–94% renewal probability. Passives (7–8) — 62–71% renewal probability. Detractors (0–6) — 24–38% renewal probability. For Detractors, renewal probability drops below 30% when NPS remains in detractors for two consecutive quarters. The financial impact: replacing a 10,000 sq ft tenant costs $150,000–300,000 in tenant improvement allowances, leasing commissions, and vacancy carry. Moving a Detractor to Promoter yields 5–8x ROI on service improvement investment. OxMaint's retention analytics dashboard flags tenants with declining NPS trends 9–12 months before lease expiration — giving facility managers a retention intervention window.
Book a demo to see predictive retention modeling for your portfolio.
TENANT EXPERIENCE AI — OXMAINT
Every Maintenance Interaction Is a Renewal Conversation — Start Measuring What Matters
Post-work order NPS · Quarterly relationship tracking · Response time correlation · Retention analytics · Technician scorecards — all integrated into your existing CMMS workflow.