Every delivery fleet has a number it does not like to look at closely: cost per mile. It creeps up quietly, a few cents at a time, until a route that used to be profitable barely breaks even. The cause is rarely one dramatic failure — it is a pattern of small, avoidable maintenance mistakes that compound across dozens of vans over a full year. Fleet managers who isolate and fix these specific mistakes typically see cost per mile drop within a single quarter, without adding headcount or replacing vehicles. Below is the breakdown of what these mistakes actually cost, and what fixing them is worth to a mid-size delivery fleet, plus how to start a free trial or book a demo to fix them.
Six Maintenance Mistakes Quietly Inflating Your Cost Per Mile
Cost per mile is a lagging indicator of maintenance discipline. These are the specific mistakes driving it up — and the estimated cost of each one, per van, per year.
What Each Mistake Costs Per Van, Per Year
This is not a guess — it is the pattern most last-mile fleets show once maintenance and telematics data are combined in one system. Use it to estimate the fleet-wide impact before deciding where to focus first.
| Maintenance Mistake | Typical Annual Cost / Van | Root Cause | Fix |
|---|---|---|---|
| Skipping oil interval by mileage drift | $310 | Manual tracking, no auto trigger | Mileage-based PM auto-scheduling |
| Delayed brake pad replacement | $540 | Wear caught too late | Predictive wear tracking |
| Underinflated tires ignored | $280 | No TPMS alert routing | Telematics-linked tire alerts |
| Ignored check-engine codes | $920 | Fault codes not surfaced to dispatch | Auto work order on fault code |
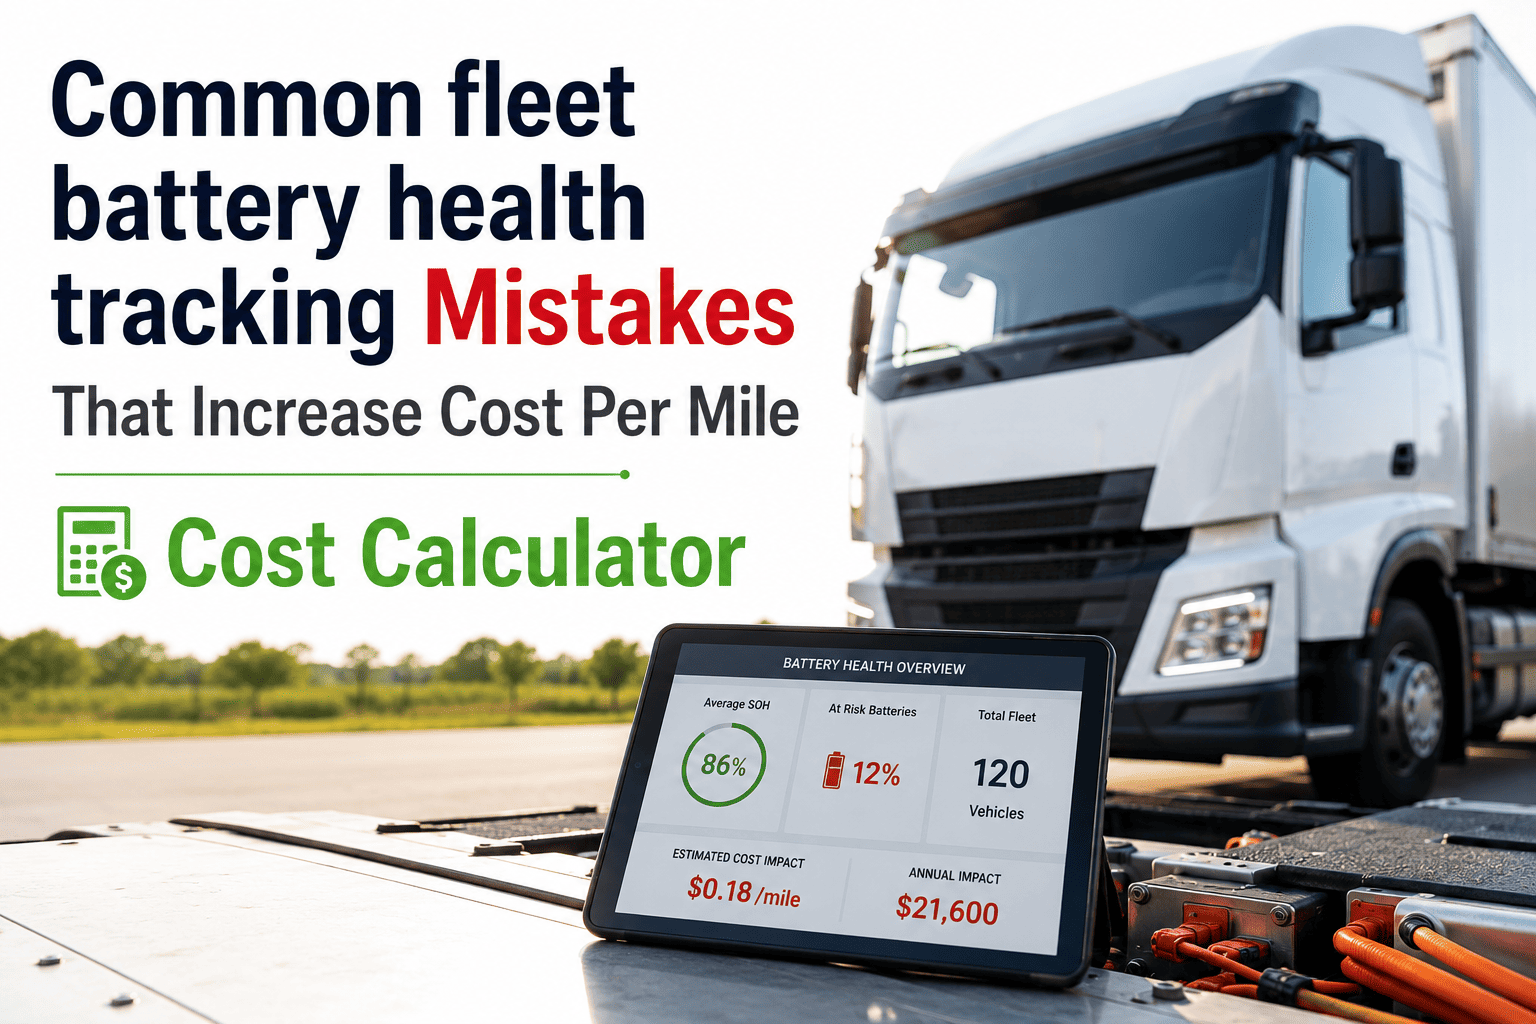
| Reactive battery replacement | $190 | No health trend visibility | Battery health scoring |
| Missed DVIR follow-up items | $410 | Verbal reports, no work order link | Digital DVIR-to-work-order routing |
Six Mistakes Add Up to Roughly $2,650 Per Van, Per Year
Multiply that across a fleet of fifty vans and the number is difficult to ignore — over $130,000 in avoidable annual cost, most of it hidden inside "normal" repair spend rather than flagged as preventable. Oxmaint surfaces each of these mistakes automatically before they turn into a work order.
Where Each Mistake Actually Comes From
Vans logged by paper or spreadsheet routinely run 1,500 to 3,000 miles past their oil interval, accelerating engine wear that shows up months later as a bigger repair bill.
Without a wear trend, pads get replaced only after a driver reports grinding — by then rotors are often damaged too, turning a $150 job into a $540 one.
A fault code that stays live for three weeks because no one is watching the telematics feed is the single most expensive mistake on this list.
A driver-noted issue that stays verbal instead of becoming a work order is, functionally, an issue that never gets fixed until it fails on route.
Six Signs Your Fleet Is Already Paying for These Mistakes
Cost per mile rarely spikes overnight — it drifts. These are the early signals that show up in the data before the number on the spreadsheet gets embarrassing.
A vehicle returning to the shop for a related issue within 60 days usually means the root cause was never actually fixed.
Even a two-week slip on an oil or filter interval compounds across a fleet into thousands in avoidable engine wear.
A telematics feed showing active codes with no corresponding repair record is a direct line to next quarter's bigger bill.
Tires wearing out faster than the manufacturer interval usually point back to unresolved alignment or pressure issues.
Driver comments logged but never converted into a work order are, in practice, issues that were never actually addressed.
A steady upward trend, even a small one, is the clearest sign that several of these mistakes are compounding at once.
How Oxmaint Closes These Gaps Without Adding Headcount
Fixing these mistakes is not about hiring more technicians — it is about routing the data you already collect so nothing slips through unnoticed.
Oil, filter, and fluid intervals trigger off live odometer readings instead of a spreadsheet someone forgets to update.
A qualifying fault code creates a prioritized work order automatically, closing the gap between detection and repair.
Predictive scoring flags replacement windows before a driver reports grinding brakes or a low-tread tire on route.
A driver-logged issue routes directly to the maintenance queue with a photo, instead of staying a verbal comment.
Battery health tracked over time replaces reactive replacement after a no-start call strands a driver.
Every repair and PM job rolls into a live cost-per-vehicle figure, so drift gets caught in weeks, not at year-end review.
What Fleets See After Closing These Gaps
Combined annual impact of the six mistakes above, per vehicle
Typical reduction within two quarters of closing the routing gaps
Achievable once intervals trigger automatically off mileage data
Every qualifying code becomes a work order, not a missed alert
Frequently Asked Questions
How is cost per mile actually calculated?
Which mistake has the biggest financial impact?
How quickly can a fleet reduce cost per mile?
Does fixing these mistakes require new hardware?
Is this estimate accurate for smaller fleets too?
Stop Paying For Mistakes You Can See Coming
Oxmaint connects fault codes, PM schedules, and DVIR reports into one system, so the mistakes on this list turn into work orders automatically instead of showing up as next quarter's repair bill.