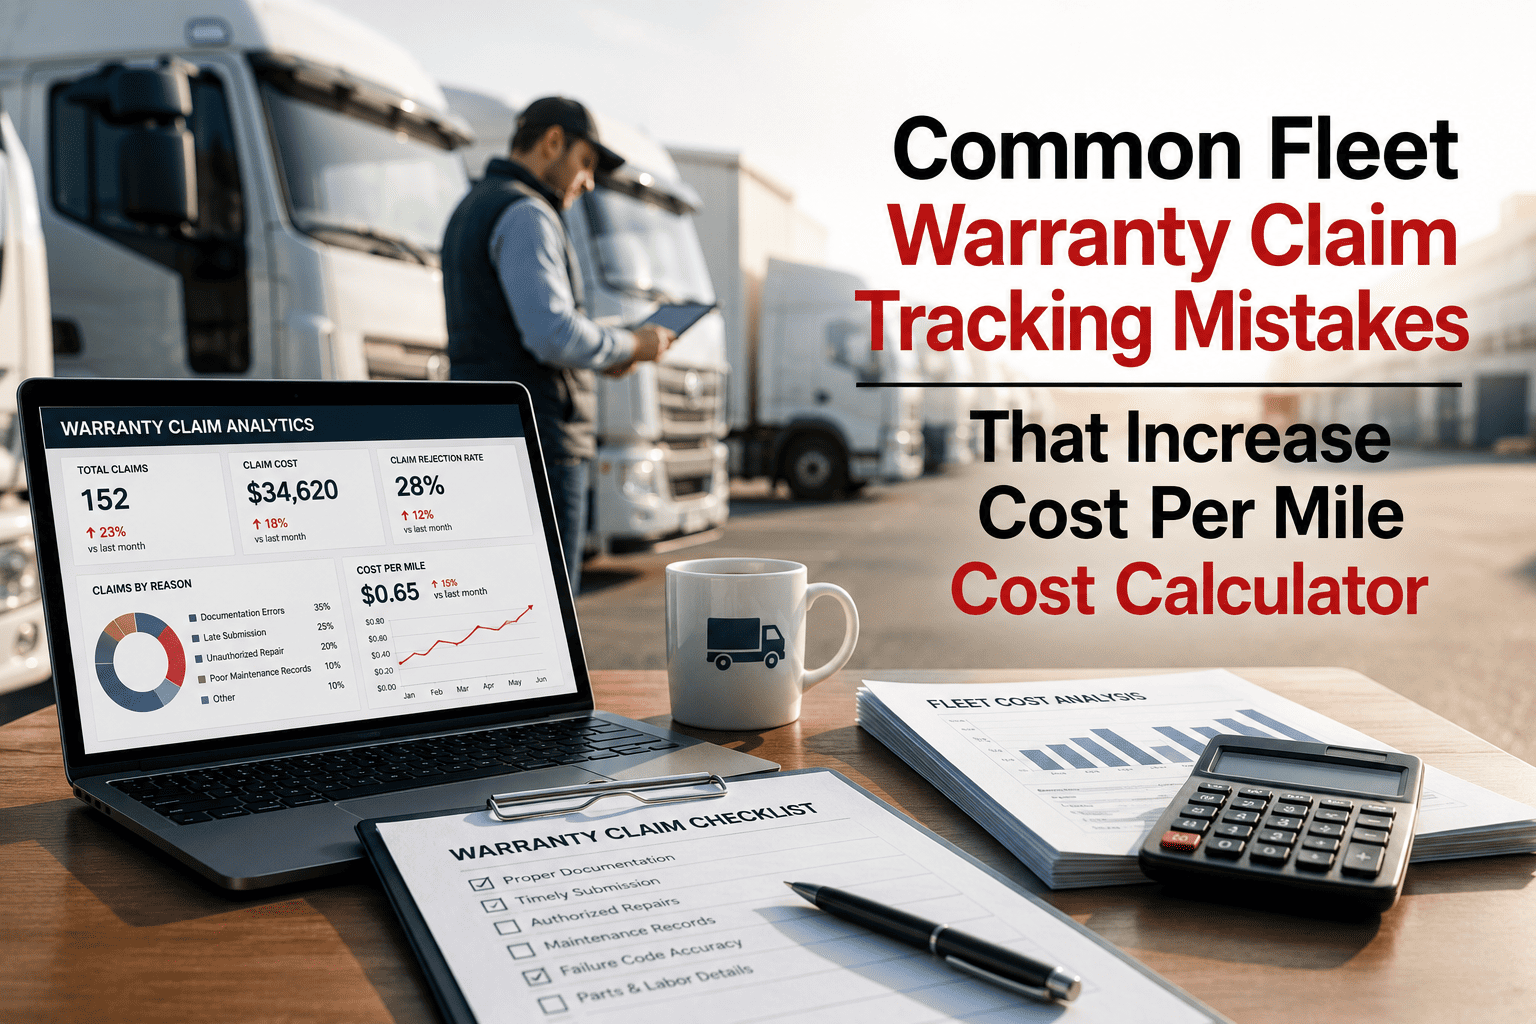
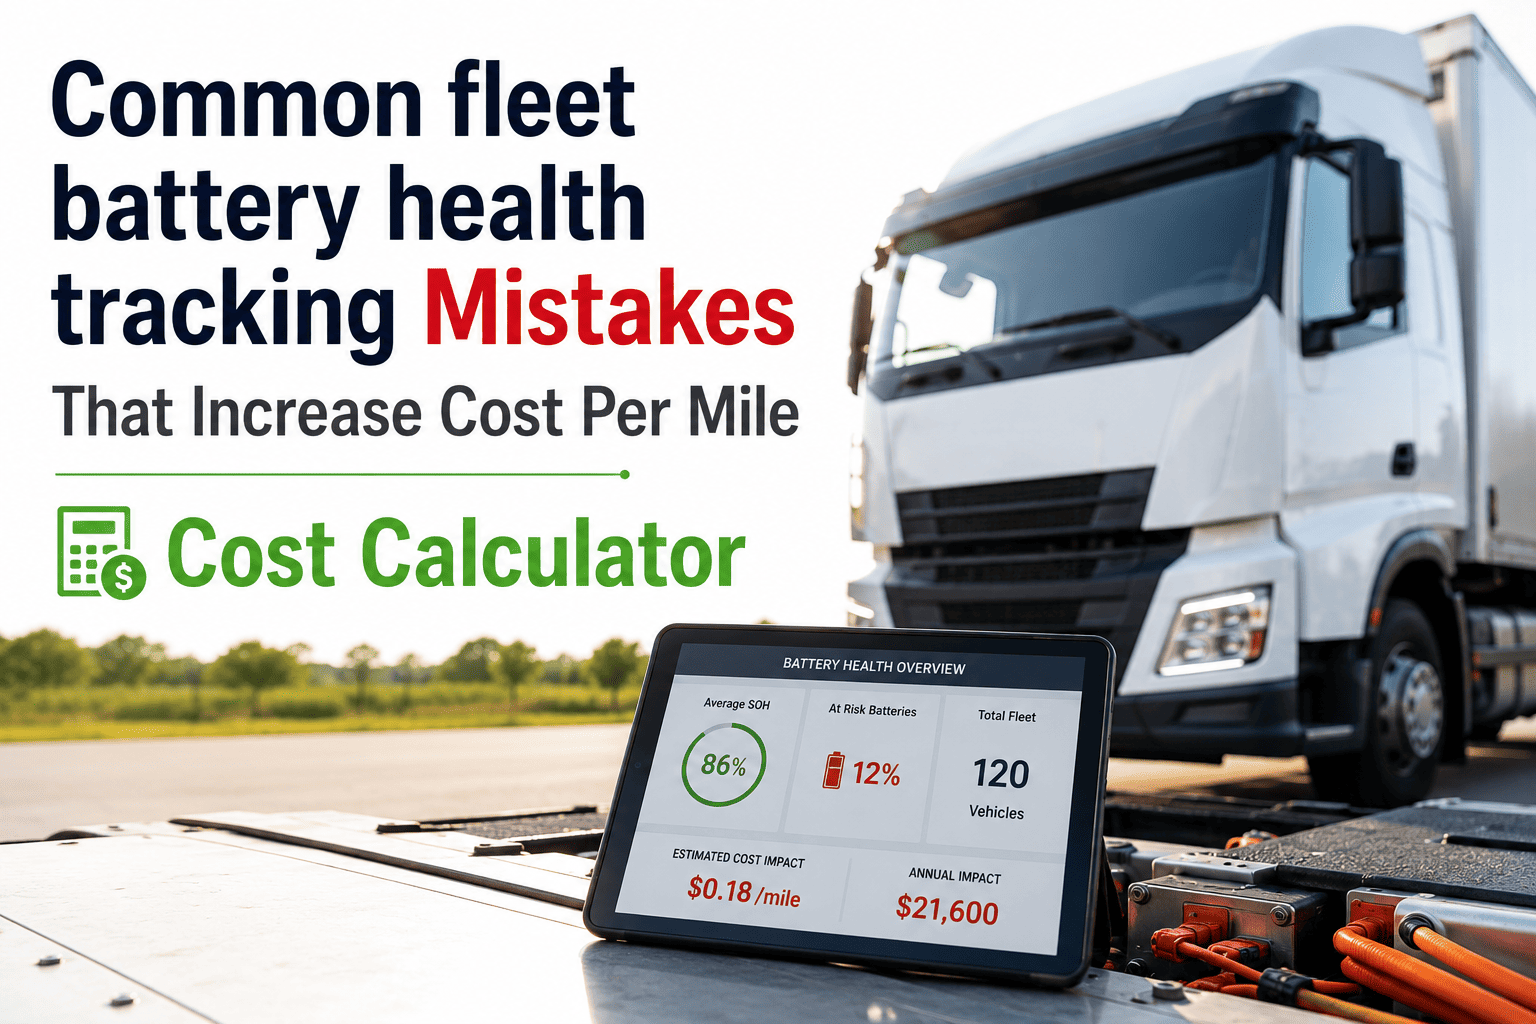
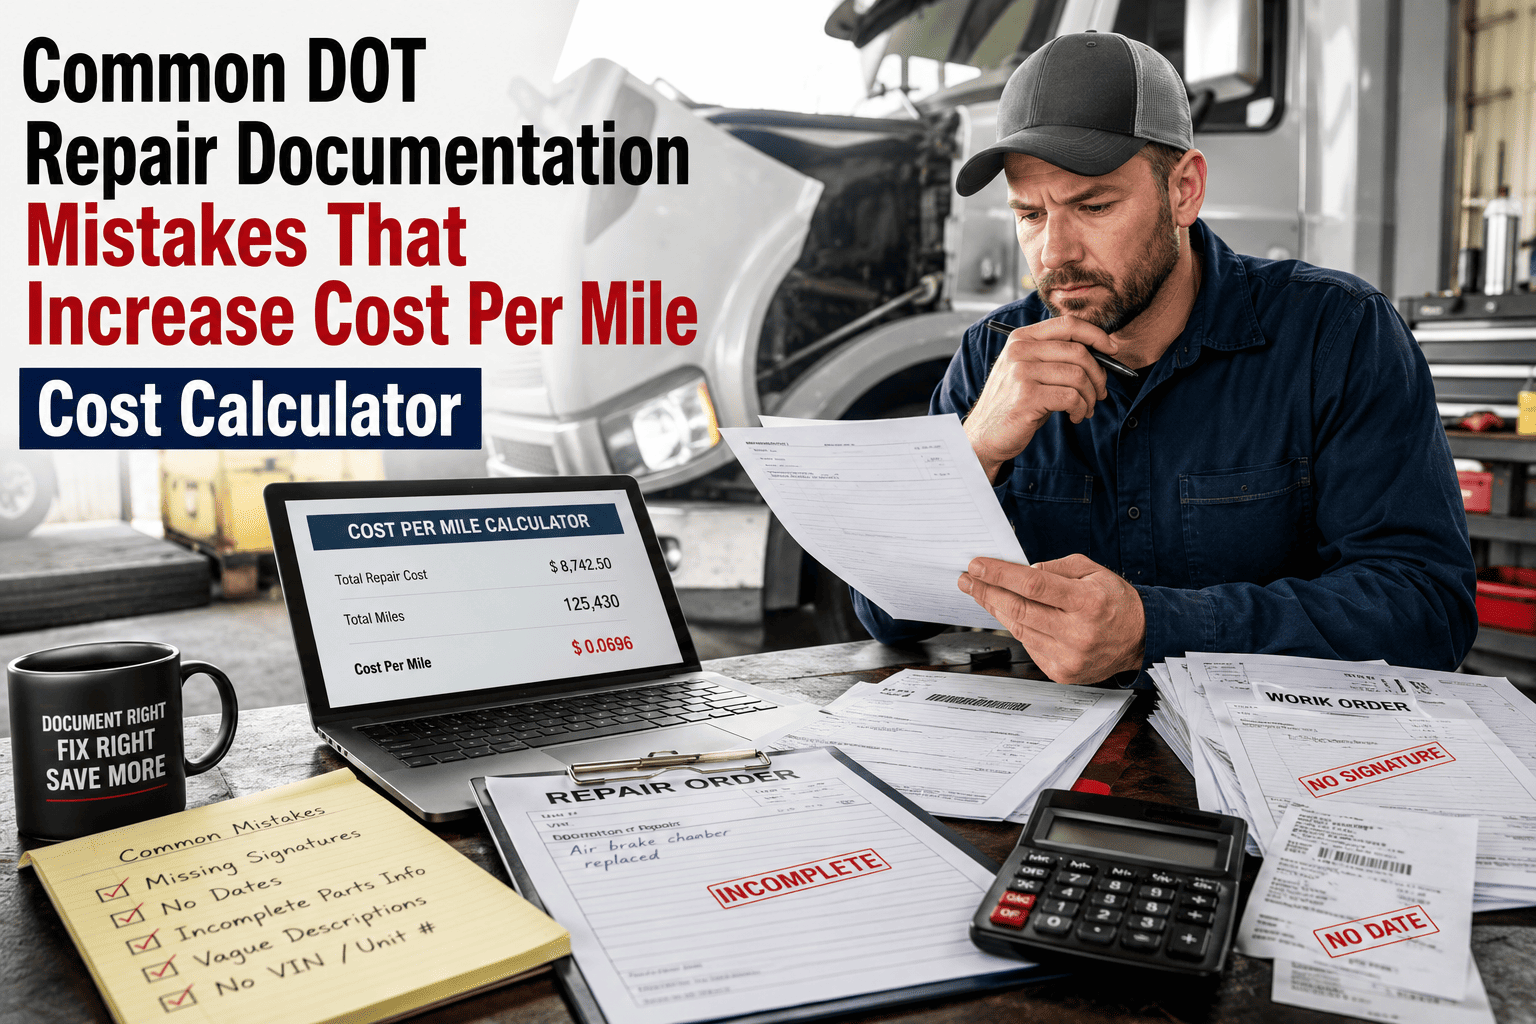
If you run a 50-truck fleet at the industry average $0.20 cost per mile and 80,000 miles per truck per year, you are spending $800,000 annually on maintenance. The same fleet, run badly, lands at $0.31 per mile — that is $1,240,000. The $440,000 gap is not a budget category. It is the cumulative price of seven or eight specific operating mistakes that look harmless on any individual work order and devastating when added up across a year. Most fleet managers cannot name the mistakes because each one looks like normal operations until the cost-per-mile number is plotted against benchmark. The list below names them, quantifies what each one costs per mile, and walks through the cost calculator a mobile fleet maintenance app should be running on your data every week — see what your current mistake load is costing you with OxMaint's cost-per-mile tracking.
Cost Per Mile · Mistake Calculator
Eight Mistakes That Quietly Add $0.11 Per Mile to Your Fleet — And the Math to Find Them
The fleet running at $0.31 per mile is not run by bad people. It is run by people who cannot see what each individual mistake is costing in cumulative terms. The calculator below makes the invisible cost visible — mistake by mistake, dollar by dollar.
Industry CPM benchmark band
The Baseline: Where Your Fleet Probably Sits Today
Before you can quantify what the mistakes cost, you need the starting number. ATRI's 2026 benchmark puts the heavy-duty industry average at $0.202 per mile — representing 8.9 percent of total fleet operating expenses. Top-quartile fleets achieve $0.12 to $0.18 per mile through structured preventive programs.
Industry CPM (ATRI 2026)
$0.202 per mile
Top-quartile CPM
$0.12 – $0.18 per mile
Bottom-quartile CPM
Over $0.30 per mile
Annual repair per truck (US heavy-duty)
$16,192
Gap to close on a 100-truck fleet at 80K miles each
~$800,000 annually
The Eight Mistakes — Quantified
Each mistake below is calibrated against published industry benchmarks. The "CPM penalty" column shows how much each one adds to your cost per mile when left unchecked. Stack four or five of these and a fleet that should run at $0.20 lands at $0.30.
M1
Tolerating a high reactive-to-planned ratio
Industry average is 45 percent reactive. Top fleets run under 20 percent. Reactive repairs cost 3 to 9 times more than the same job done planned — emergency engine work, expedited parts, overtime labour, and downtime cascades all stack on the invoice.
Severity: Critical
CPM penalty
+$0.04 / mile
M2
Holding vehicles past the replacement breakpoint
Vehicles over 10 years old cost $1.10 per mile to maintain versus $0.20 for newer assets — a 450 percent difference. Aging assets consume 33 percent of fleet maintenance spend while representing only 12 to 18 percent of miles driven.
Severity: Critical
CPM penalty
+$0.03 / mile
M3
Outsourcing repairs that could move in-house
Outsourced labour runs $125 to $175 per hour. In-house technician cost is $45 to $75 per hour. LTL carriers handle 78 percent of work in-house. Truckload averages 55 percent. Every shop hour outsourced unnecessarily is a measurable dollar gap.
Severity: High
CPM penalty
+$0.018 / mile
M4
Missing warranty claim windows
Most OEM warranty windows close at 30 to 90 days from repair. Fleets without digital claim tracking leave 30 to 50 percent of eligible recovery on the table. For a 100-truck fleet that is typically $80K to $140K annually in unrecovered reimbursement.
Severity: High
CPM penalty
+$0.015 / mile
M5
Running parts inventory blind
Stockouts force expedited parts at 3 to 5x normal cost. Duplicate inventory at each yard ties up capital. Without network-wide inventory visibility, fleets typically carry 28 to 35 percent of WO spend in parts versus the best-in-class 18 to 22 percent.
Severity: High
CPM penalty
+$0.012 / mile
M6
Skipped or delayed preventive maintenance
Skipped oil changes alone cause 30 to 40 percent of engine failures. PM compliance below 80 percent means major component failures arrive earlier and cost more. The downstream cost of a missed $200 PM can be a $15,000 engine event.
Severity: High
CPM penalty
+$0.014 / mile
M7
Untracked driver behaviour wear
Aggressive acceleration and braking increase brake wear 30 to 50 percent and fuel consumption 15 to 20 percent. Without driver score tracking linked to vehicle history, the worst behaviour stays invisible and the worst repairs keep arriving.
Severity: Medium
CPM penalty
+$0.008 / mile
M8
Running low-utilisation vehicles
Vehicles driven under 10,000 miles per year have CPM of $1.50 to $2.00 versus $0.80 to $1.20 for fully utilised vehicles. Underutilisation is invisible without per-vehicle mileage tracking — and it inflates fleet-wide CPM without showing up in any individual repair invoice.
Severity: Medium
CPM penalty
+$0.009 / mile
Cumulative CPM penalty when all eight mistakes run unchecked
+$0.116 per mile
Translation: $0.20 industry-average fleet becomes a $0.316 bottom-quartile fleet
Stop paying for invisible mistakes
Find Out Which of the Eight Mistakes Your Fleet Is Paying For — In Dollars, This Week
OxMaint runs the cost-per-mile calculation against your live work order, parts, and labour data — flagging each of the eight mistakes with its specific dollar impact on your fleet. No spreadsheet exports required.
The Calculator Worked Through: A 50-Truck Fleet at 80K Miles Each
This is the same fleet, run two different ways, with the math shown. Every number ties to a benchmark from the previous section.
Mistake-Loaded Fleet
Industry baseline CPM
$0.202
+ Reactive ratio over 40 percent
+$0.040
+ Aging vehicles past 10 years
+$0.030
+ Excess outsourcing
+$0.018
+ Missed warranty claims
+$0.015
+ Parts inventory blind spots
+$0.012
Effective CPM
$0.317
Annual maintenance spend
$1,268,000
Same Fleet, Mistakes Fixed
Industry baseline CPM
$0.202
- Reactive ratio cut to 25 percent
-$0.035
- Replace 3 worst-aging vehicles
-$0.022
- In-house PM and brake work
-$0.012
- Digital warranty claim filing
-$0.013
- Cross-yard parts visibility
-$0.008
Effective CPM
$0.157
Annual maintenance spend
$628,000
Annual savings recovered by fixing the eight mistakes
$640,000
On the same 50-truck fleet running the same routes — without buying more equipment
Which Mistakes Cost the Most by Severity Band
Critical
M1 Reactive ratio · M2 Aging vehicles
Combined CPM impact: $0.07 per mile
Fix horizon: Current quarter
High
M3 Outsourcing · M4 Warranty · M5 Parts · M6 PM
Combined CPM impact: $0.059 per mile
Fix horizon: Next 90 days
Medium
M7 Driver wear · M8 Underutilisation
Combined CPM impact: $0.017 per mile
Fix horizon: Next 6 months
Frequently Asked Questions
How accurate are the CPM penalty numbers — do they apply to my specific fleet?
The penalty ranges are calibrated against ATRI 2026 data and apply to heavy-duty trucking fleets. Light-duty and specialty fleets shift the percentages but the directional impact holds. Run your own data through OxMaint to see the specific dollar number for your fleet.
How long does it take to fix the high-impact mistakes once we start tracking them?
Reactive ratio drops 10 to 15 points in the first 90 days of disciplined PM scheduling. Warranty recovery improvements show up in 30 days. Aging vehicle replacement is a 6 to 12 month decision based on data accumulation. Book a demo to see the timeline against your fleet.
Do we need telematics or sensor data to run this calculation?
No — the eight-mistake CPM calculation runs on standard work order, parts, and labour data. Telematics enhances M7 (driver behaviour) but the other seven mistakes are visible from CMMS records alone. Start a trial at app.oxmaint.ai.
What if our fleet is mostly leased — does this still apply?
Leased fleets carry less M2 (aging vehicle) exposure but the other seven mistakes apply identically. Lease-managed fleets often have higher M3 (outsourcing) and M4 (warranty) penalty exposure because of contract repair routing.
How often should we re-run this CPM calculation?
Monthly at the fleet level, weekly at the vehicle level for the top 10 percent of CPM offenders. The point is to catch rising CPM on a specific vehicle 60 to 90 days before it forces a replacement decision under emergency conditions.
From hidden cost to recovered margin
Every Mile Your Fleet Runs Either Carries These Eight Mistakes or It Does Not
The calculator is built into OxMaint. Plug in your fleet, your mileage, your work orders — see exactly which mistakes are costing you what, and what closing them frees up for the rest of the operation.