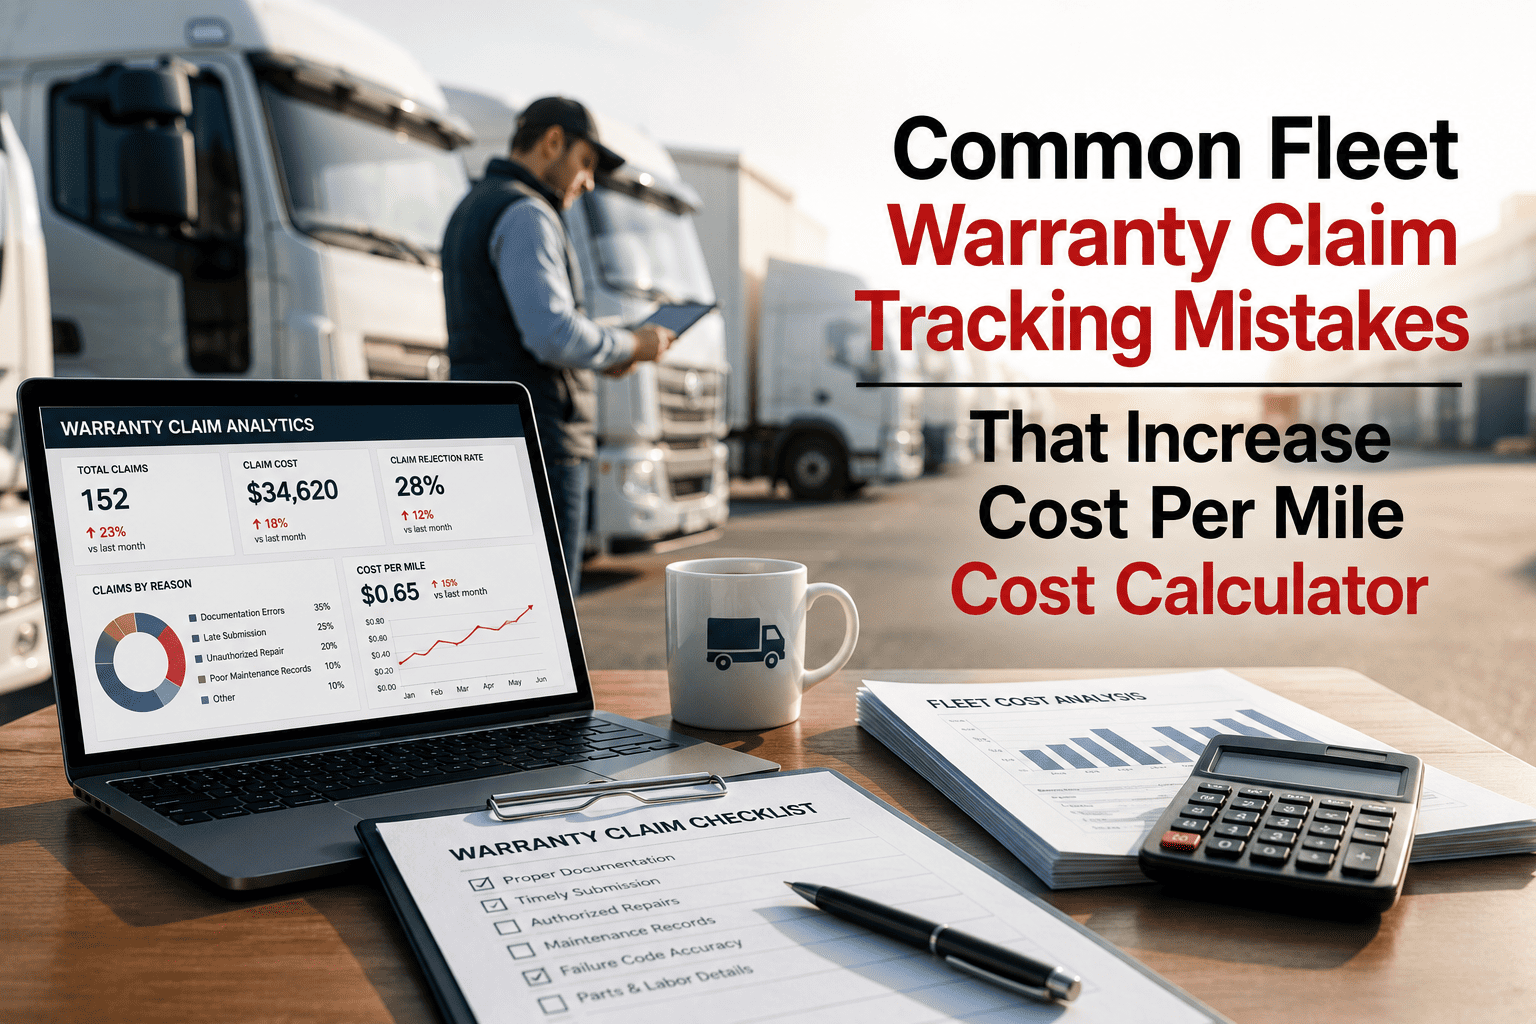
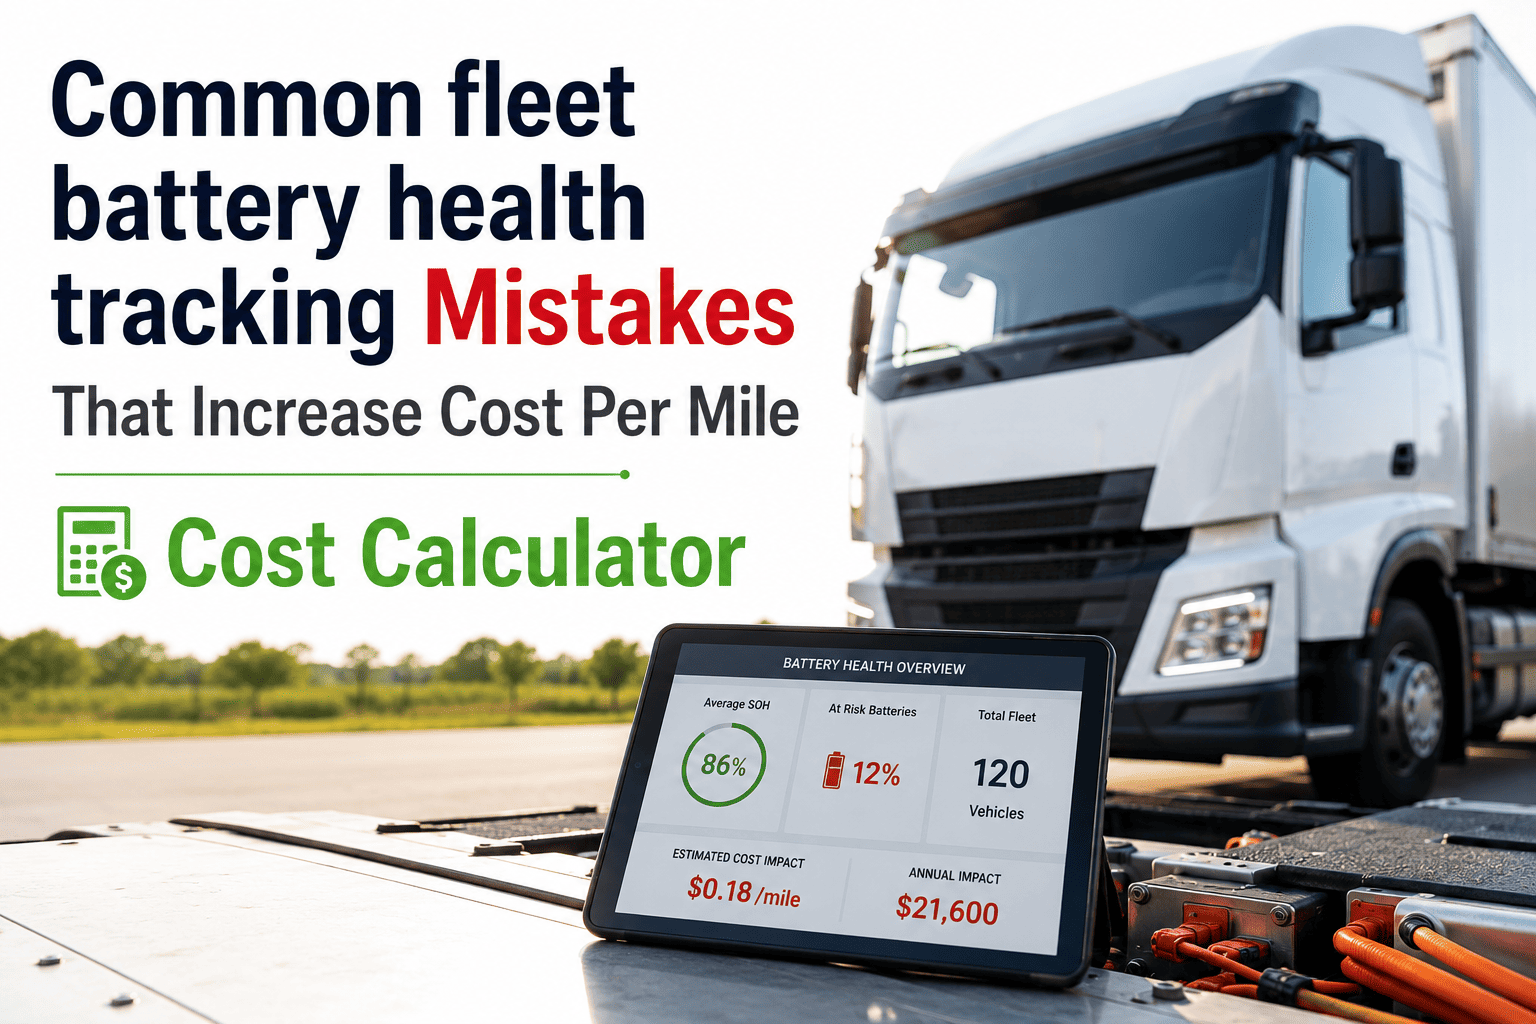
Warranty coverage recovers 8–20% of repair costs — yet the average fleet reclaims barely half of what it is owed, and every unclaimed dollar lands directly on cost per mile. On a Class 8 truck running at $0.15–$0.20 per mile in maintenance, a single missed powertrain claim can push that vehicle's CPM up by cents that compound across hundreds of thousands of miles. This page breaks down the specific warranty tracking mistakes that silently inflate your cost per mile, shows you how to size the leak with a simple calculation, and points to where the money is hiding in your own numbers.
OxMaint · Warranty Mistakes & Cost Per Mile
Cost per mile is the most honest number in your fleet. Missed warranty claims quietly corrupt it — one unfiled claim at a time.
Every warranty dollar you fail to recover stays in the numerator — and drives CPM up for the life of the vehicle.
Size Your Own Warranty Leak in Four Steps
You do not need software to estimate what poor warranty tracking is adding to your cost per mile. Walk this calculation with your own fleet's numbers.
Step 1
Total your annual repair spend
Pull every repair invoice for the year across parts and labour. Call this figure R.
Example: a 100-truck fleet spends R = $1,200,000/yr on repairs.
Step 2
Apply the warranty-eligible share
Roughly 8–20% of repair cost is typically warranty-recoverable. Use 12% as a conservative midpoint: eligible = R × 0.12.
Example: $1,200,000 × 0.12 = $144,000 eligible for recovery.
Step 3
Subtract what you actually recovered
Manual trackers recover only 40–60%. The unrecovered remainder is money you spent that the OEM owed you.
Example: recovering 50% leaves $72,000 unclaimed every year.
Step 4
Divide by annual miles to find CPM impact
Unclaimed dollars ÷ total fleet miles = the cents per mile your tracking gap adds.
Example: $72,000 ÷ 9,000,000 miles = $0.008/mile of pure avoidable cost — before compounding across the vehicle lifecycle.
Lift recovery from 50% to 90% on that same fleet and you pull roughly $57,600 back out of the numerator — every single year.
Seven Tracking Mistakes That Silently Raise Cost Per Mile
Each of these is common, each is invisible on a standard budget report, and each shows up later as an unexplained rise in CPM.
1
Paying for Repairs Still Under Warranty
Authorizing work without checking coverage first means the fleet absorbs a cost the OEM would have covered. It hits CPM at full price instead of zero.
CPM effect: full repair cost lands on the vehicle instead of the manufacturer
2
Missing Claim Deadlines by Days
A valid claim filed late is a denied claim. Without automated deadline alerts, eligible reimbursements expire quietly and permanently.
CPM effect: recoverable dollars convert to sunk cost
3
Losing the Documentation
When failure records, photos, or service history cannot be found, the claim cannot be validated. Paper logs get rejected where digital records would be approved.
CPM effect: 40–50% of warranty value typically left unclaimed
4
Voiding Coverage by Missing PM
Skipping a required service can void the warranty on a component entirely — turning a covered failure into a full out-of-pocket repair later.
CPM effect: converts future covered claims into full-cost events
5
Never Auditing the Reimbursement
Manufacturers flat-rate labour; a 10-hour job may only pay 6. Few fleets audit what actually comes back, so shortfalls compound unnoticed on CPM.
CPM effect: partial reimbursements silently understate recovery
6
Ignoring Repair Volatility
Repair volatility is the number one enemy of CPM stability. Untracked warranty coverage lets random turbo, DPF, or injector failures spike CPM instead of staying a known line item.
CPM effect: unpredictable spikes replace a planned cost
7
Averaging Cost Instead of Tracking Per Vehicle
Fleet-wide averages hide the trucks bleeding money on repairs that should have been claimed. Per-vehicle CPM exposes the warranty gaps averages conceal.
CPM effect: problem assets stay invisible until replacement
Turn the Leak Into Recovered Margin
OxMaint links every part to its warranty terms and expiration, flags eligible claims at repair time, and calculates cost per mile per vehicle automatically — so warranty gaps surface before they inflate CPM to run the numbers on your own fleet or of the cost-per-mile dashboard.
Benchmark: Where Cost Per Mile Should Sit
Warranty recovery is only one lever on CPM, but it is one of the few that returns money you already spent. Use these reference points to judge whether your maintenance CPM has room to fall.
| Vehicle / Fleet Profile | Maintenance CPM Benchmark | What Drives It |
| New Class 8, under warranty |
$0.05–$0.08 / mile |
Most repairs covered — if claims are actually filed |
| Well-maintained Class 8, lifecycle avg |
$0.12–$0.18 / mile |
PM discipline plus consistent warranty recovery |
| ATRI industry average |
$0.202 / mile |
Mixed recovery, mixed PM compliance |
| Light / medium-duty |
$0.15–$0.25 / mile |
Rises sharply past warranty and high mileage |
| Vehicle over 10 years old |
Up to 5.5× a sub-5-year vehicle |
Out of warranty, major component failures |
| Replacement trigger |
Annual maint. > 40–45% of value |
CPM trend, not vehicle age, signals the point |
Scroll right to view the full table on mobile
Frequently Asked Questions
OxMaint · Cost Per Mile · Warranty Recovery · CMMS
Every warranty claim you miss is added cost per mile you cannot explain. OxMaint catches eligible claims at repair time and tracks CPM per vehicle — so the leak closes and the number falls.
Coverage flagged at repair time. Deadlines automated. Reimbursements audited. Cost per mile calculated per vehicle, in real time.