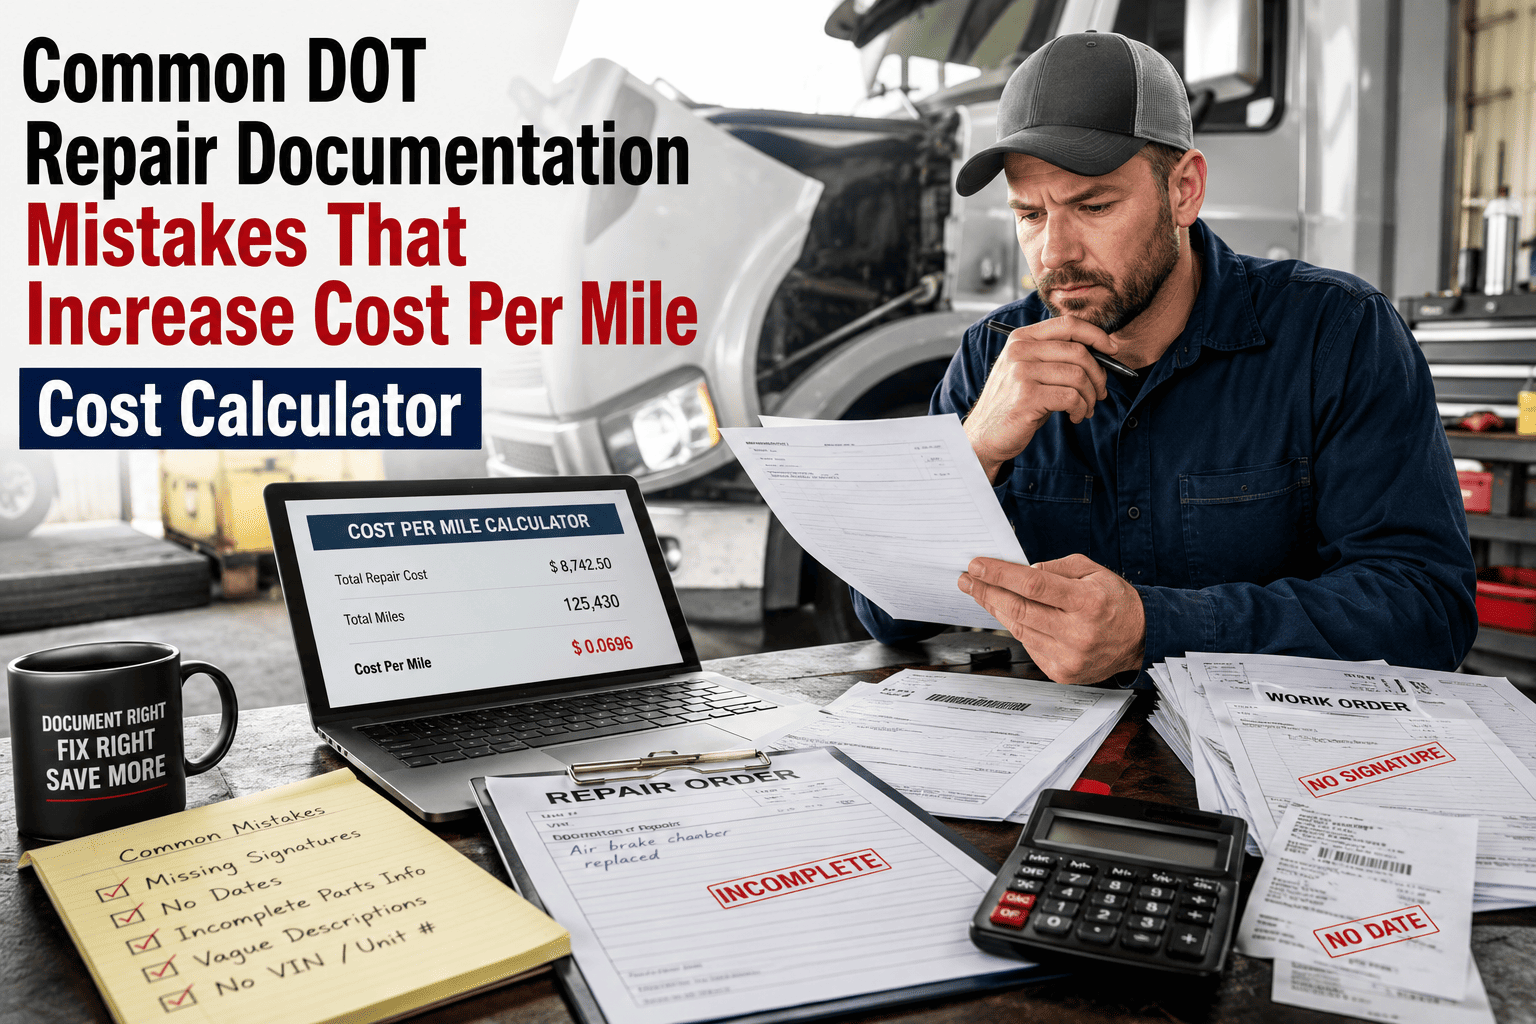
A 40-truck regional carrier ran a fleet-wide maintenance cost that looked perfectly acceptable on the monthly report — right up until a per-vehicle breakdown revealed three tractors running at roughly double the fleet average, quietly consuming a disproportionate share of the budget on a fraction of the miles. The hidden driver was not fuel and not parts pricing; it was documentation. Missed DVIR-to-repair links turned small defects into roadside breakdowns, and untracked maintenance due dates pushed planned work into reactive work that costs three to nine times more per event. Cost per mile is the one number that exposes all of it, and OxMaint maintenance and cost tracking calculates it for every vehicle automatically.
Cost Per Mile · DOT Documentation Mistakes · OxMaint
The Documentation Mistake You Cannot See On The Monthly Report Is Adding Cents To Every Mile — And Cents Times Millions Of Miles Is Real Money.
Reactive repairs cost 3–9× more than planned maintenance. Most of that gap traces back to a defect that was reported but never converted into action. This is what each documentation gap costs per mile.
The Cost-Per-Mile Ready Reckoner
Find your reactive-repair share on the left, read the estimated maintenance cost per mile across the row. Based on US fleet benchmarks where reactive repair averages roughly 4× planned cost per event.
Reactive Repair Share
Est. Maintenance CPM
Annual Cost · 40 Trucks · 90k mi
Position
20% reactive
≈ $0.19/mi
≈ $684,000
Best in class
35% reactive
≈ $0.23/mi
≈ $828,000
Healthy
55% reactive
≈ $0.28/mi
≈ $1,008,000
Typical — room to improve
70% reactive
≈ $0.32/mi
≈ $1,152,000
Documentation-driven loss
Illustrative estimates using a $0.16/mi planned baseline and a 4.2× reactive multiplier from published US fleet data. Moving from 55% to 20% reactive on this example fleet recovers roughly $324,000 per year — almost entirely by converting reported defects into documented, planned work before they fail.
A 40-truck fleet moving from 12 to 7 annual breakdowns can save roughly six figures a year — before counting the service disruption those breakdowns caused.
OxMaint captures labour, parts, and vendor cost at work-order close and calculates cost per mile per vehicle automatically — no spreadsheets.
Five Documentation Mistakes That Quietly Raise Cost Per Mile
+$0.08–0.20/mi
A defect is reported but never linked to a work order
The single most expensive gap. A reported defect that never reaches the shop becomes a roadside failure. Reactive repair runs 3–9× the planned cost, and every dollar of unplanned repair carries $3–$5 in hidden cost — towing, rental units, expedited parts, and lost productive miles.
+$0.05–0.12/mi
Maintenance due dates are not tracked
A missed PM interval is a violation and a cost driver at once. Deferred preventive work shifts the planned-to-reactive ratio the wrong way, and every deferred PM has a downstream failure cost larger than the PM itself.
5× the cost
Cost is tracked fleet-wide, not per vehicle
A healthy fleet average hides the outliers. Vehicles over ten years old can run more than 5× the per-mile cost of newer units while covering a fraction of the miles. Without per-vehicle documentation, the fleet repairs a $20,000 problem on an $8,000 asset.
Hidden 30–40%
Only invoice totals are recorded, not indirect cost
Direct repair invoices are only 60–70% of true maintenance cost. Downtime, administrative overhead, and expedited procurement make up the rest — and they never appear unless documentation captures the full event.
Lost wrench time
Work orders lack complete task and parts detail
Average technician wrench time sits at 58–65% without structured work orders. Time lost waiting for parts and chasing information is labour cost with zero output — and labour is the largest single line for most fleets.
The Deferral Math — Why The Cheap Choice Is Always The Expensive One
OxMaint · Real-Time Cost Per Mile
Stop Estimating Cost Per Mile In A Spreadsheet. OxMaint Calculates It Per Vehicle, Automatically, At Every Work-Order Close.
See exactly which vehicles drain profitability, which defects became breakdowns, and which intervention moves the number most.
Frequently Asked Questions
How do documentation mistakes actually raise cost per mile?
A reported defect that never becomes a work order turns into a reactive repair costing 3–9× the planned equivalent, plus downtime and expedited parts. OxMaint converts every defect into a tracked work order automatically. Start free to track it.
How quickly does better documentation reduce maintenance cost per mile?
Most fleets see measurable reduction within 60–90 days of moving toward 80% planned maintenance, with the full annual impact compounding over 6–12 months as breakdowns and emergency repairs fall.
Why track cost per mile per vehicle instead of fleet-wide?
Fleet averages hide outliers. A small number of aging units often consume an outsized share of spend on a fraction of the miles. Per-vehicle tracking surfaces the unit to repair, coach, or replace.
Does OxMaint calculate cost per mile without manual data entry?
Yes. Labour hours, parts cost, and vendor invoices are captured at work-order close and rolled into cost per mile, cost per vehicle, and reactive-versus-planned spend in real time.
Can it separate planned from reactive maintenance cost?
It tracks planned PM work orders and reactive breakdown work orders separately, so the cost ratio between them becomes visible — the clearest justification for investing in a documented PM program.
Every Documentation Gap Is A Number. OxMaint Puts That Number On Your Screen — Per Vehicle, Per Mile, Today.
Automatic cost capture · per-vehicle cost per mile · reactive-vs-planned split · defect-to-work-order routing.