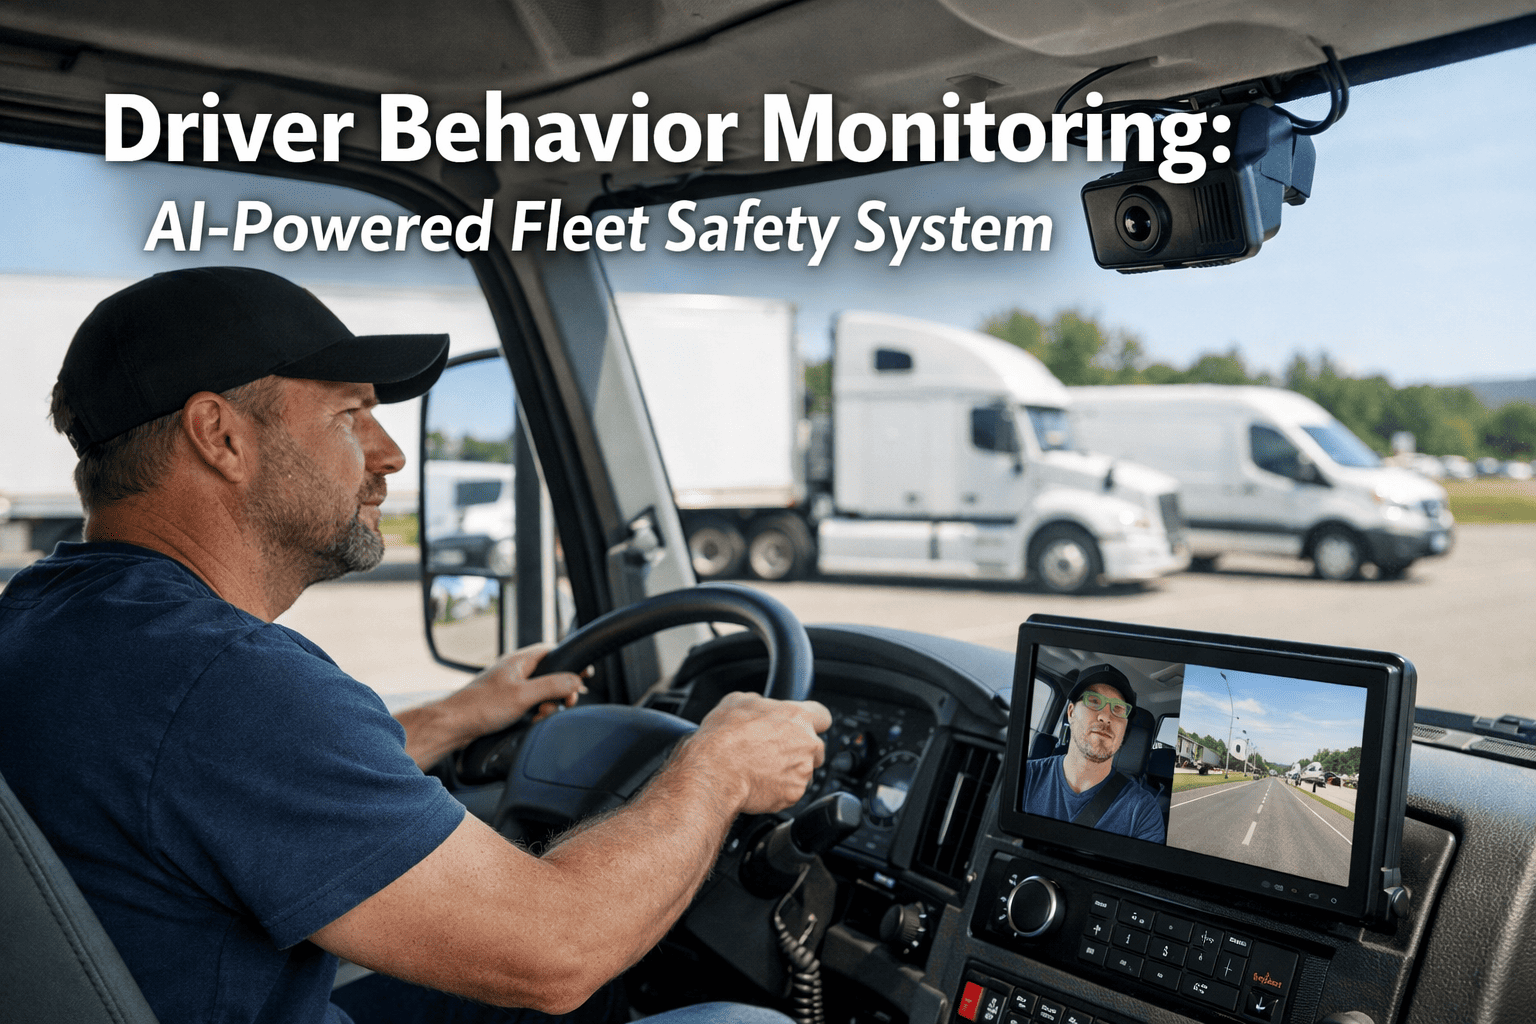
Driver Behavior Monitoring: AI-Powered Fleet Safety System
By Jack Miller on April 11, 2026
A national parcel delivery company in Seattle had a driver with a clean safety record, consistent on-time performance, and seven years without a formal incident report. In October 2024, that driver was involved in a rear-end collision that resulted in $94,000 in vehicle damage, a $38,000 third-party claim, and a 19% insurance premium increase at renewal. When the telematics data from the prior 90 days was reviewed in the accident investigation, the pattern was unmistakable: 18 harsh braking events per 100 miles, 26% of drive time above the speed threshold, and consistent following-distance violations that the company had never seen because they had no dashboard that surfaced the data. OxMaint's AI driver behaviour monitoring platform scores every driver continuously across six safety dimensions — harsh braking, speeding, acceleration, cornering, phone use, and seatbelt compliance — and generates coaching alerts weeks before behaviour patterns become collision statistics. Book a demo to see your fleet's safety scores in real time.
See Every Driver's Risk Score — Before It Becomes a $94,000 Accident.
Harsh braking · speeding · phone use · fatigue · seatbelt — AI scored per driver, real-time — OxMaint
Accident cost that 90 days of visible telematics data would have prevented — Seattle delivery driver
42%
Average accident rate reduction at US fleets deploying AI behaviour monitoring with structured coaching
12%
Insurance premium discount available to fleets with documented safety monitoring and coaching programmes
Six Driver Behaviours OxMaint AI Monitors — All Are Accident Predictors
Each of the six behaviours below has a documented statistical relationship with accident probability in FMCSA and NHTSA crash causation data. OxMaint scores every driver on all six from OBD and AI camera data — with per-event logging, shift-level reporting, and rolling 30-day trend scores per driver.
Highest crash predictor
Harsh Braking
Events above 0.4g deceleration — tracked per 100 miles
Drivers with >8 harsh braking events/100 mi are 3.1× more likely to be in a rear-end collision within 12 months. OxMaint alert fires at >10 events/100 mi sustained over 3 shifts.
Speed violation
Speeding
% of drive time above posted speed limit >10 mph
Each 5 mph above 65 mph raises fatal accident probability 8%. Every 1% reduction in over-speed driving reduces fleet fuel cost $0.03–$0.06/mile simultaneously.
Drivetrain wear
Harsh Acceleration
Events above 0.35g — fuel and component wear indicator
Aggressive acceleration predicts following-distance problems and adds $0.07–$0.12/mile in excess fuel burn. 30% reduction in harsh acceleration events saves $900–$2,200/vehicle/year.
Rollover risk
Cornering Events
Lateral G-force above 0.4g — tyre and suspension wear
High cornering G-force predicts tyre sidewall damage and suspension wear — most critical for Class 6–8 trucks and vans with high centre of gravity. Sustained high cornering scores trigger OxMaint tyre inspection work order.
Liability critical
Phone Use While Driving
AI camera detects phone held or viewed while moving
Texting while driving increases crash risk 23×. AI camera vision in OxMaint detects phone use events in real time — timestamped per event with photo evidence for coaching and HR documentation.
Legal exposure
Seatbelt Non-Compliance
% of trips started without seatbelt engaged
Unbelted drivers are 30× more likely to be ejected in a crash. OxMaint detects seatbelt state at trip start via OBD — any non-compliance generates an immediate manager push notification, not an end-of-week report.
Driver Safety — OxMaint
Score Every Behaviour. Coach Before the Crash.
OxMaint AI identifies your highest-risk drivers and sends coaching alerts — so managers are acting on data, not incidents.
How does your fleet compare? The benchmarks below show industry median vs top-quartile US fleet safety scores across all six monitored behaviours — based on FMCSA carrier safety data and OxMaint telematics aggregates from US customer fleets.
Four technology layers work simultaneously — OBD telematics for kinematic events, AI camera vision for distraction and fatigue, AI scoring for coaching triggers, and integration with insurance and compliance systems for premium evidence.
OBD Integration — Kinematic Event Capture
Every harsh braking, acceleration, cornering, and speeding event is captured from OBD telematics — timestamped, GPS-located, and linked to the driver's profile. Events feed into the rolling 30-day safety score per driver automatically. Telematics platforms already connected (Samsara, Geotab, Verizon) integrate via API — no new hardware required for most fleets.
AI Camera Vision — Distraction & Fatigue Detection
In-cab AI cameras detect phone use, eye closure, head drop, and yawning — generating real-time in-cab alerts for the driver and immediate manager notifications with timestamped photo evidence. Distraction events are logged to the driver's safety record with the same permanence as OBD kinematic events — creating a complete behaviour picture that neither camera nor telematics alone can provide.
AI Scoring Engine — Predictive Risk Ranking
OxMaint AI weights all six behaviour dimensions by their statistical accident-predictive power — assigning each driver a 0–100 risk score that updates after every shift. The score predicts accident probability, not just ranks relative performance. Fleet managers see their bottom quartile highlighted every Monday morning — automatically, without running a report.
Insurance & Compliance Evidence Export
OxMaint generates the documentation package that commercial vehicle insurers request at renewal — 12 months of safety scores, coaching session records, and trend data per driver. Fleets presenting this documentation qualify for 8–15% premium discounts. In litigation, the same documentation demonstrates due diligence and duty of care — the most powerful defence against negligent entrustment claims.
42%
Accident rate reduction
12%
Insurance premium discount
23%
Fuel cost reduction
35%
Improvement in driver retention
We always thought we knew which drivers were safe. After OxMaint, we discovered our "safe" drivers were our safest on paper — but our OBD data told a completely different story. We went from 11 recordable incidents to 4 in 12 months. Our insurer gave us a 12% discount at renewal. The ROI on the monitoring system was positive within the first 6 weeks from fuel savings alone.
— VP of Safety, 280-Vehicle LTL Fleet, Atlanta GA · OxMaint customer since 2023
Frequently Asked Questions
Yes — OxMaint integrates via API with Samsara, Geotab, Verizon Connect, and Motive. If your fleet already has telematics, driver behaviour scoring activates within days of integration. No new hardware required for OBD-based monitoring.
Yes — OxMaint's driver app shows each driver their current score, weekly trend, and specific events. Transparent driver-facing scores are the single most effective behaviour change lever — more effective than manager-only dashboards alone.
OxMaint's AI camera model is trained on in-cab scenarios — it distinguishes phone-to-ear, phone-in-hand at wheel, and eyes-down-to-screen from eating, adjusting controls, and other normal cab activities. False positive rate is below 2% on calibrated installations.
OxMaint generates a fleet safety programme report — 12 months of per-driver scores, coaching session records, trend data, and incident correlation — formatted for commercial vehicle insurer underwriting requests. Most insurers accept OxMaint reports directly for premium review.
Most drivers show measurable score improvement within 2–4 weeks of the first evidence-based coaching session. Fleet-wide accident rate reduction typically materialises within 90–180 days as coaching becomes consistent across the bottom quartile of the driver pool.