Every fleet manager who has priced out dash cams has heard the same pitch about safety and accountability, but the number that actually gets a purchase order signed is the one on the insurance renewal letter. Video telematics earns its budget line through three overlapping returns: lower premiums at renewal, faster and cheaper resolution of liability claims, and a measurable drop in the crashes that create both problems in the first place. Those three returns do not arrive on the same day, which is exactly why so many ROI conversations stall before they start. This guide breaks down what actually pays back, in what order, and how fast — with numbers by fleet size so you can build a business case instead of a guess. If you want to model your own numbers before you commit budget, you can start a free trial and pull the calculation from your own fleet data.
Video Telematics · ROI Breakdown · 2026
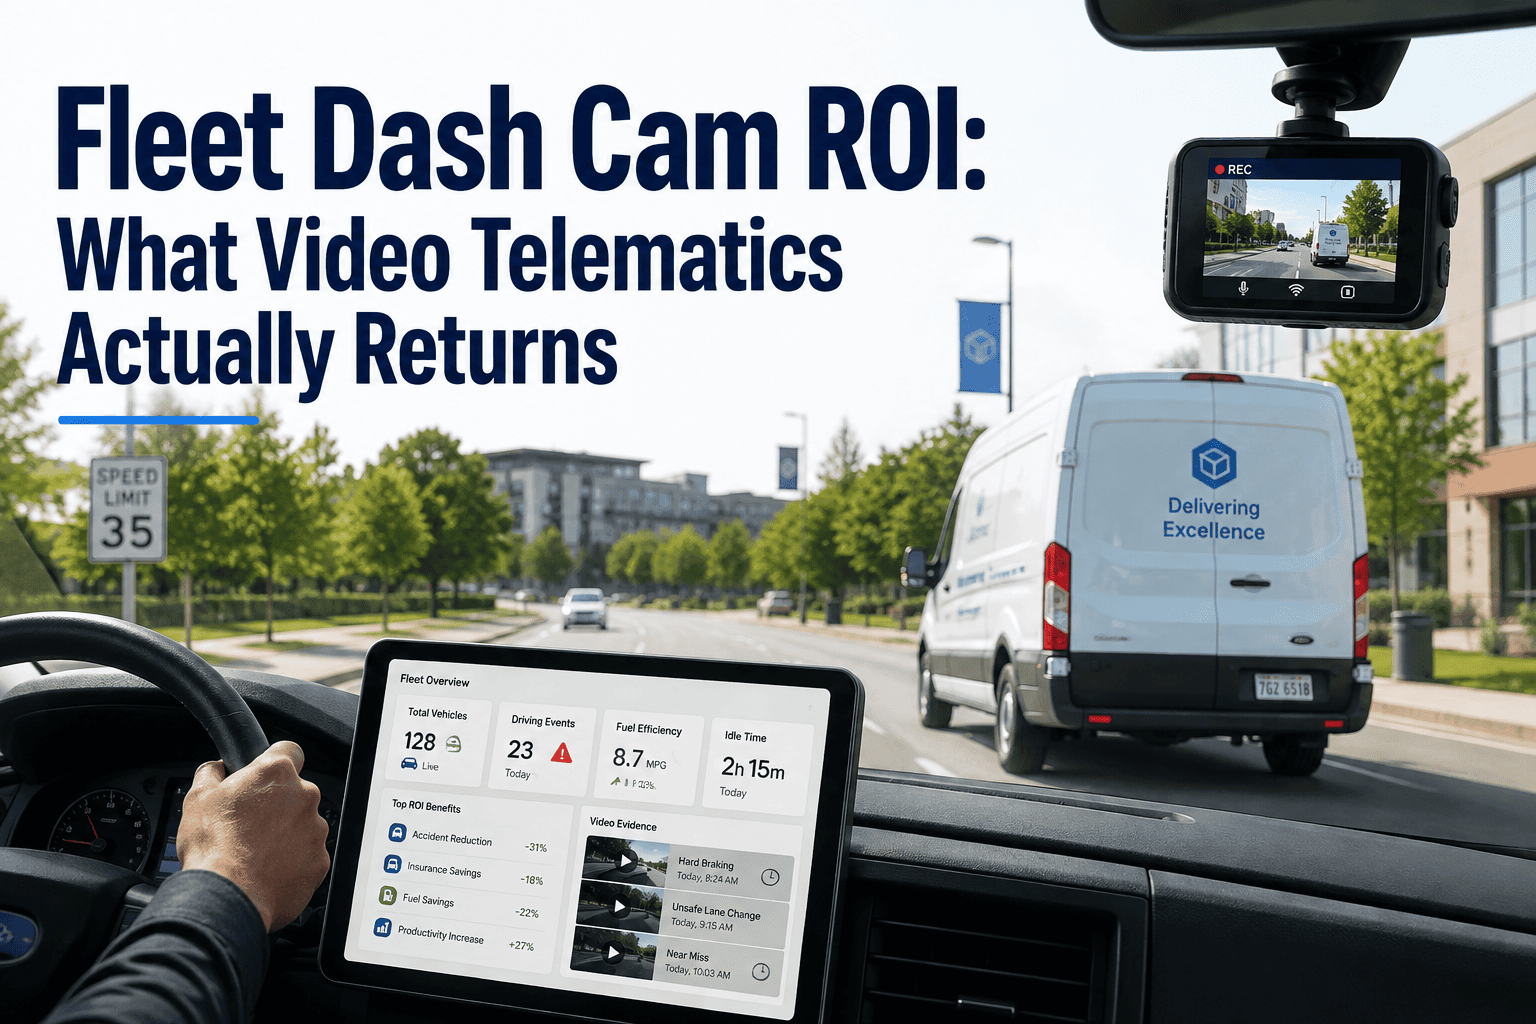
Fleet Dash Cam ROI: What Video Telematics Actually Returns
Insurance first, litigation second, safety compounding underneath both. Here is the real payback model behind fleet dash cam investment — not the sales pitch, the math.
15-30%
Typical insurance premium reduction in year one for fleets running documented camera programs
6-12 mo
Median payback window across small, mid-size, and enterprise commercial fleets
20-30%
Reduction in preventable collisions once drivers know footage is reviewed and coached
$5K-$25K
Value of a single exonerated not-at-fault claim, often on its own covering months of subscription cost
Where the ROI Actually Comes From — In Order
The mistake most fleets make is pricing dash cams purely as a safety tool and then feeling disappointed when the safety numbers alone do not justify the spend. Safety is real, but it is the slowest-moving and hardest-to-isolate return of the three. Insurance and litigation move faster and are easier to point to on a spreadsheet, which is why they carry the case in year one. Understanding the order these returns arrive in changes how you present the investment internally — and how soon you can honestly report a win.
1
Insurance Premiums
This is the fastest and largest lever. Carriers increasingly price commercial auto risk using telematics data directly, and a documented camera program with active coaching routinely earns a double-digit percentage reduction at the next renewal. On a fleet paying six figures in annual premium, that single line item can cover the entire camera program before any claim is ever filed.
2
Litigation and Claims
Most commercial crashes involving your vehicle are not your driver's fault, but without footage, liability defaults to whoever has the deeper pockets. A single exonerated claim routinely saves five figures, and video evidence also cuts the average cost of claims that do settle by shortening the dispute and reducing nuclear-verdict exposure.
3
Safety and Behavior
This return compounds rather than arrives in a lump sum. Drivers who know footage is reviewed brake harder less often, follow closer less often, and get distracted less often. That shift lowers claim frequency over the following renewal cycles, which is why year-two and year-three savings tend to outperform year one.
ROI by Fleet Size — What the Numbers Look Like
The mechanics of the return are identical at any scale, but the pace at which each fleet size feels the win differs. Smaller fleets lean harder on the litigation and exoneration return because a single bad claim represents a larger share of their annual risk budget. Larger fleets feel the insurance-premium return first because carriers price large books of business on aggregate telematics data, and that data starts flowing from day one.
| Fleet Size |
Primary ROI Driver |
Typical Payback |
What Moves First |
| Under 25 vehicles |
Claim exoneration |
3-6 months |
One avoided at-fault claim often covers the year |
| 25-100 vehicles |
Blended insurance and claims |
6-9 months |
Renewal discount plus fewer contested claims |
| 100-500 vehicles |
Premium renewal reduction |
7-10 months |
Aggregate risk score improves underwriting terms |
| 500+ vehicles |
Premium plus coaching-driven frequency drop |
8-12 months |
Fleet-wide behavior trend becomes statistically visible |
The Payback Timeline, Month by Month
Because the three returns arrive on different schedules, most fleets underestimate ROI in the first ninety days and overestimate how long full payback will take. Here is the realistic sequence, based on how deployments typically play out.
Days 1-30
Behavior Shift Begins
Harsh braking, speeding events, and following-distance violations drop almost immediately once drivers know footage is reviewed. No dollars land yet, but the leading indicators do.
Days 30-90
First Claims Get Resolved Faster
Any incident during this window resolves with footage instead of a he-said-she-said dispute. This is typically where the first hard dollar savings show up, often from a single exonerated claim.
Months 4-8
Insurance Conversation Opens
With a documented program and early claims data in hand, brokers can bring the camera program into renewal negotiations. Some carriers apply mid-term adjustments; most apply the discount at the next renewal date.
Months 6-12
Full Payback Reached
Combined savings from claims, premium reduction, and lower crash frequency typically cross the total program cost somewhere in this window, with larger fleets landing toward the later end.
A Simple Version of the Math
You do not need a complex model to justify the first purchase order — a conservative, defensible estimate is usually enough to get budget approved. Here is the version most fleets can build in an afternoon using their own claims history and current premium.
Annual Program Cost
Camera hardware plus subscription across the fleet, typically $250-$700 per vehicle per year depending on AI capability and camera configuration.
Claim Offset
Multiply your average at-fault claim payout by the number of claims per year that video evidence would likely have overturned or reduced.
Premium Offset
Apply a conservative 10-15% reduction to your current annual premium as a first-year estimate, then confirm the real figure with your broker at renewal.
Net Result
Add the claim offset and premium offset, subtract the program cost. Most fleets find the remaining number is positive well before the twelve-month mark.
Worked example: a 40-vehicle fleet spending roughly $18,000 a year on a mid-tier AI camera program, with one exonerated claim worth $12,000 and a 12% premium reduction on a $90,000 policy, recovers $22,800 against an $18,000 spend — payback inside the first policy year, before counting any reduction in collision frequency.
See It Against Your Own Fleet
Model Your Payback Before You Commit Budget
Oxmaint connects camera-generated safety events directly to maintenance scheduling, driver coaching records, and fleet analytics, so the same platform that tracks your ROI also helps you act on it. Run your own numbers with a free trial, or bring your claims history to a live walkthrough and we will build the payback model with you.
What Speeds Up or Slows Down Your ROI
Two fleets buying the identical camera system can land six months apart on payback. The gap almost always comes down to how the program is operated, not which hardware was chosen. These are the factors that move the timeline the most.
Coaching Consistency
Cameras that record but are never reviewed produce almost none of the behavior-change return. Weekly review of flagged events and short driver conversations are what convert footage into fewer incidents.
Baseline Claim Frequency
Fleets with a rougher claims history have more room to improve and typically see the fastest early payback, since the first few exonerations or prevented incidents represent a larger share of total risk.
Broker and Carrier Relationship
Not every carrier prices telematics data the same way. Fleets that loop their broker in early and share program data proactively tend to see premium adjustments land sooner than fleets that wait for renewal to raise it.
Camera Configuration
Dual-facing setups with AI event detection unlock the largest insurance discounts and the richest coaching data, but they also cost more and face more driver pushback than forward-facing-only deployments.
Common Ways Fleets Undercut Their Own ROI
Most disappointing dash cam results trace back to a small number of avoidable operational gaps rather than a bad product choice. Watching for these early protects the business case you built to get the program funded.
Treating Footage as Storage, Not a Workflow
Video sitting unreviewed in the cloud returns nothing. Build a standing weekly process for flagged-event review before rollout, not after adoption stalls.
Skipping the Broker Conversation
Premium reductions do not apply automatically. Someone has to bring the program and its data to the renewal table, and that conversation needs to start months in advance.
Measuring Only Hard Dollars in Month One
Behavior metrics move first and claims dollars move second. Reporting only financial ROI in the first ninety days understates a program that is already working.
Rolling Out Without Driver Buy-In
Programs framed as surveillance face resistance and disabled cameras. Programs framed around exoneration and fair coaching see faster adoption and cleaner data from day one.
Frequently Asked Questions
How fast does a fleet dash cam program actually pay for itself?
Most commercial fleets reach full payback between six and twelve months, with smaller fleets often landing sooner because a single exonerated claim covers a larger share of total cost. You can
start a free trial to model the timeline against your own claims history.
Does insurance premium reduction happen automatically once cameras are installed?
No. Carriers generally apply the discount at the next policy renewal, and only when the program and its data are actively presented during underwriting. Loop your broker in early rather than waiting for the renewal date.
Is the return mostly from insurance, or from preventing crashes?
In year one, insurance and claims resolution typically deliver the largest and fastest dollars. Crash-frequency reduction is real but compounds over subsequent renewal cycles rather than showing up as an immediate line item.
What size fleet sees the best ROI from dash cams?
Every fleet size sees positive ROI when the program is actively managed, but the driver differs: small fleets lean on claim exoneration, while large fleets lean on aggregate premium reduction.
Book a demo to see which pattern fits your fleet profile.
Do we need AI-based cameras, or is basic recording enough?
Basic recording delivers exoneration value alone. AI-based detection adds proactive coaching and typically unlocks the larger insurance discounts, since carriers increasingly want proof the fleet is using data to actively reduce risk, not just recording it.
Built for Fleets That Track Every Dollar
Turn Camera Data Into a Documented ROI Story
Oxmaint centralizes safety events, driver coaching records, and maintenance history in one platform, so the same data that wins claims and lowers premiums is always ready for your next broker conversation or board review. Explore the platform yourself, or bring your fleet's numbers to a live session and we will help you build the case.