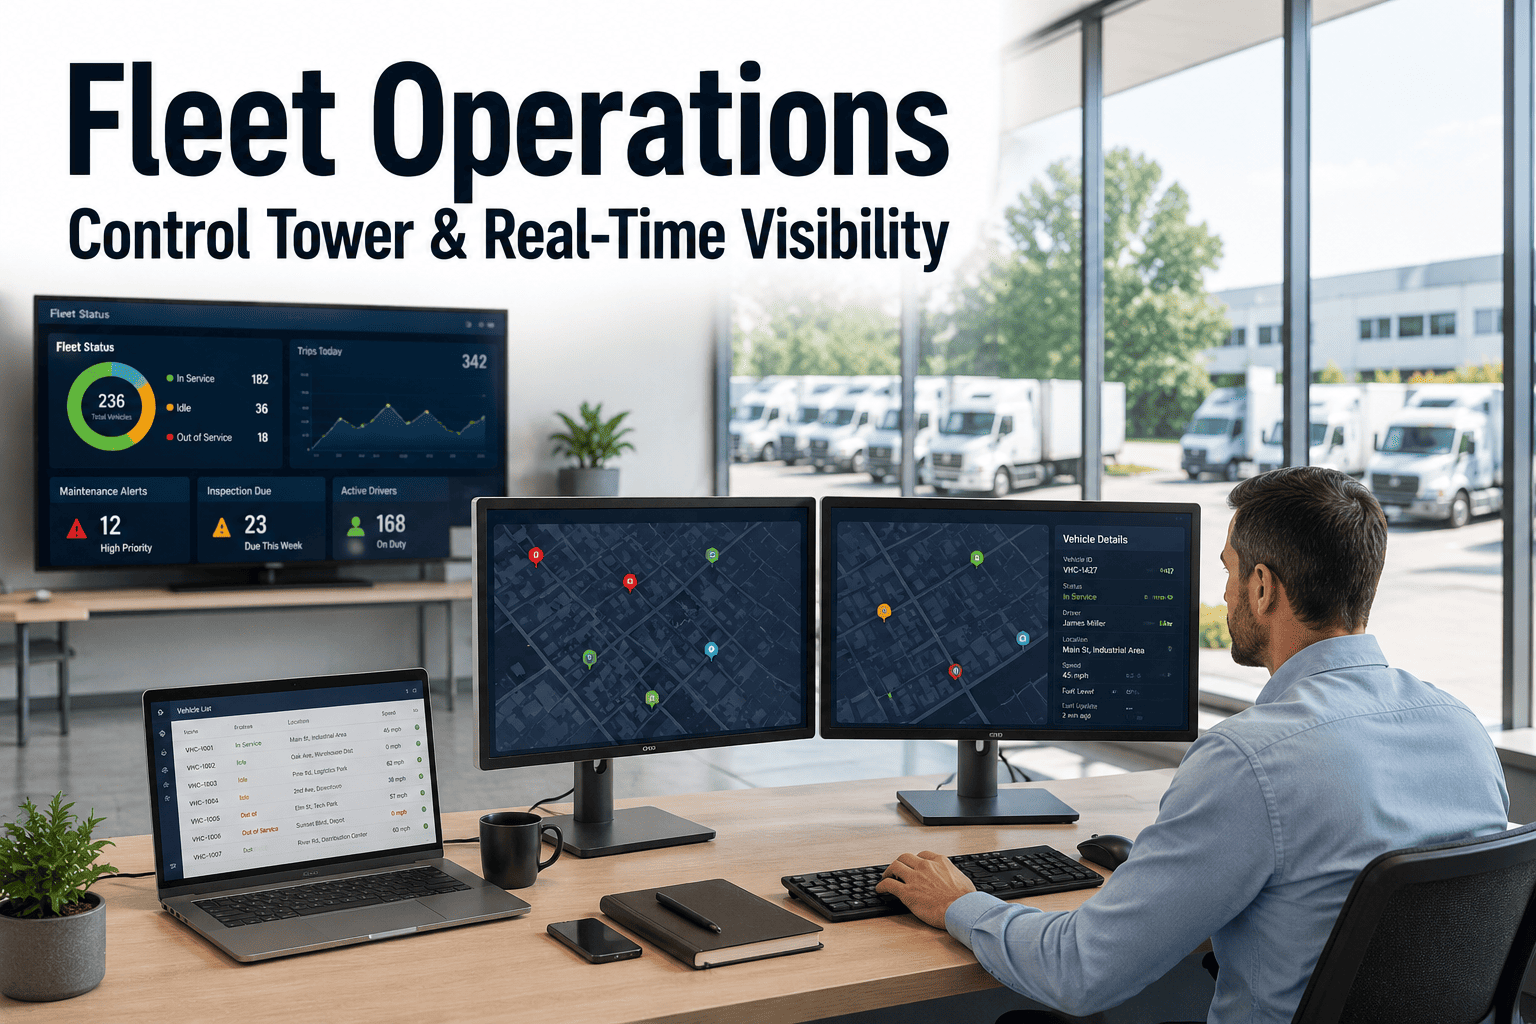
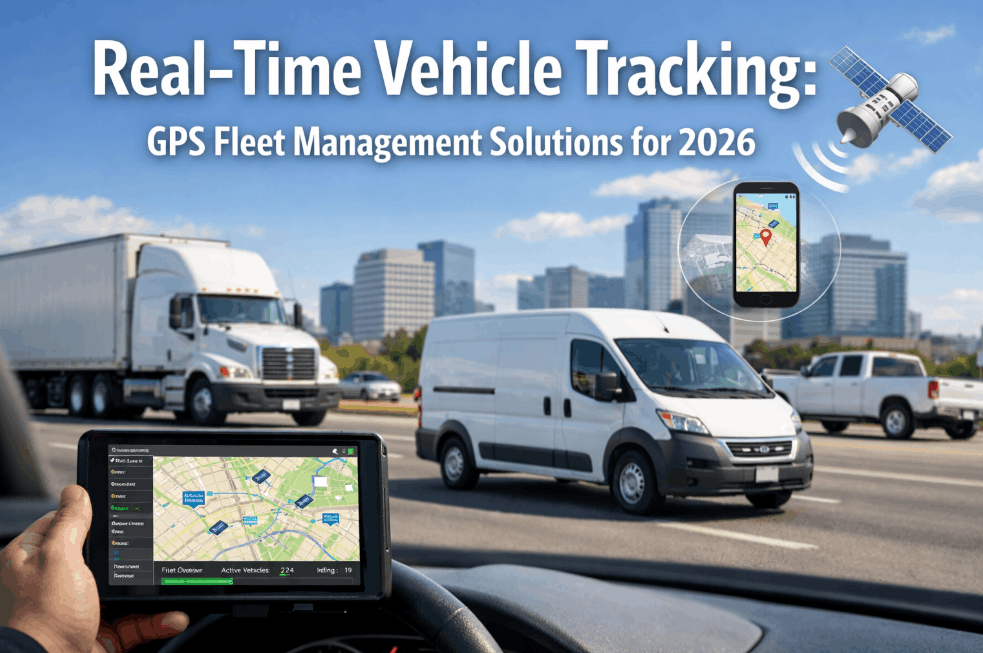
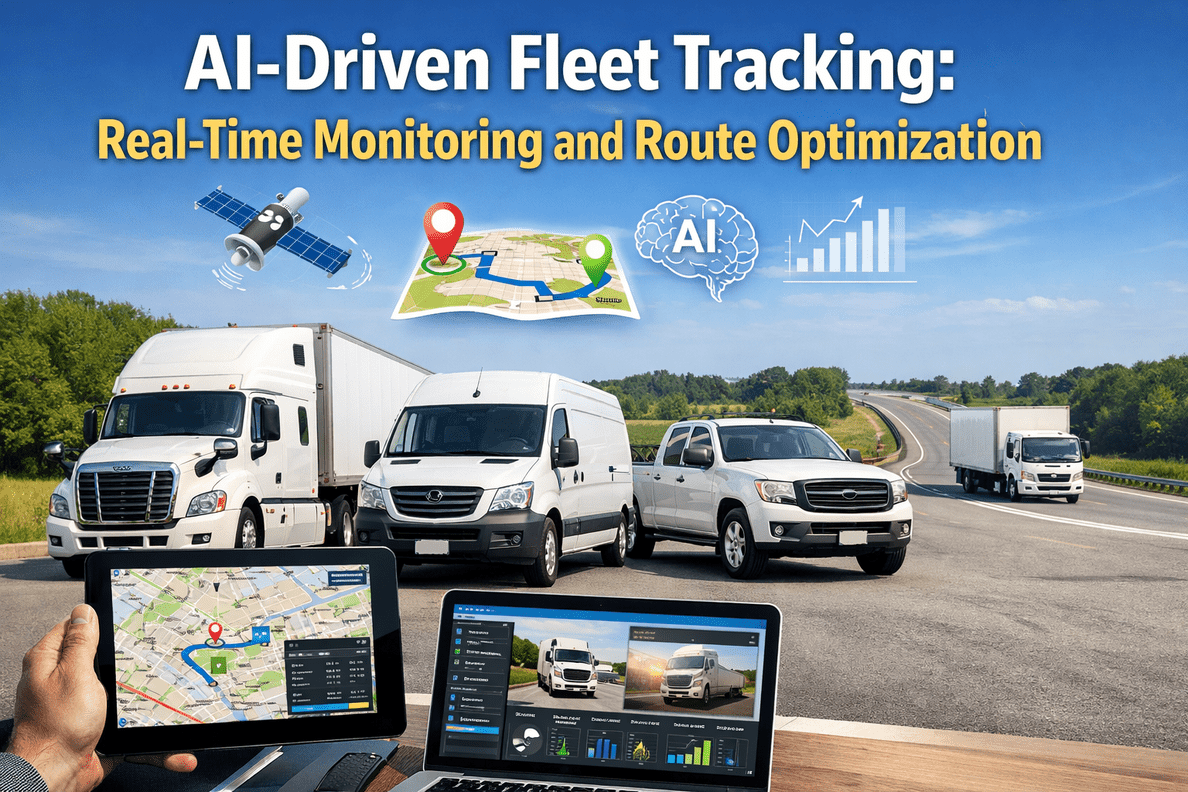
Fleet operations run on dozens of disconnected signals — GPS pings, DVIR submissions, fuel card swipes, maintenance alerts, driver messages — and by the time a dispatcher pieces them together by phone, the problem has already cost money or time. A fleet operations control tower removes that lag by pulling every live signal into one screen, so exceptions get caught in seconds instead of surfacing as a missed delivery or a roadside breakdown. Fleets running scattered tools react to problems after they happen; fleets running a control tower see them forming in real time. That single shift, from fragmented visibility to one operating picture, is what separates fleets that scale smoothly from fleets that firefight every week, and it is exactly what Oxmaint's control tower architecture is built to deliver.
Fleet Operations · Real-Time Visibility · Control Tower
Every Signal Your Fleet Sends, Watched From One Screen
A control tower does not create new data. It stops the data you already generate — location, condition, compliance, cost — from arriving too late to matter. Four live signals, one converging picture.
Signal 01 · Telematics
Vehicle drifts off its planned route
GPS and geofence data stream in continuously. A deviation triggers a flagged event before a customer ever calls to ask where their delivery is.
Signal 02 · Inspection
Driver logs a defect mid-route
The defect appears on the control tower the moment it is submitted, already scored by severity and linked to the vehicle's full history.
Signal 03 · Compliance
Hours-of-service window closes in 40 minutes
The dispatcher sees the countdown next to the load, not after a violation report lands on their desk the following week.
Signal 04 · Cost
Fuel spend on one route spikes 18 percent
The anomaly surfaces against the route baseline instantly, instead of three weeks later inside a spreadsheet reconciliation.
70%
Less time spent reconciling data across disconnected fleet tools
4x
Faster exception response when alerts route automatically to the right person
30%
Typical reduction in avoidable downtime once issues are caught in real time
1
Operating screen replacing spreadsheets, paper logs, and status phone calls
Why Fleets With Good Data Still Make Slow Decisions
Most fleets are not short on data. They are short on a place where that data becomes a decision. Five patterns below explain why visibility keeps failing even at fleets that have already invested in telematics, maintenance software, and compliance tools.
01
Every system speaks its own language
Telematics reports mileage, the CMMS reports work orders, the compliance tool reports HOS, and none of them reference the same vehicle record. Someone at HQ becomes the manual translator between systems every morning.
02
Alerts arrive, but not to the right person
A fault code fires into an inbox nobody checks until lunch. By the time it is read, the vehicle has already been dispatched on a four-hundred-mile route.
03
Dashboards show history, not the present moment
Most reporting tools refresh overnight. A fleet manager opening a report at 8 AM is looking at yesterday's fleet, not today's.
04
Exceptions get lost between shifts
A defect logged on the night shift has no guaranteed handoff to the morning dispatcher. The vehicle looks clean on paper and leaves the yard anyway.
05
Cost visibility lags two to three weeks behind reality
Fuel, maintenance, and downtime costs get reconciled at month end, long after the route or the driver behavior that caused the overrun is gone.
Anatomy of a Fleet Operations Control Tower
A control tower is not a bigger dashboard. It is a stack of four layers, each doing a specific job, so a signal generated on a vehicle becomes an action at HQ in seconds rather than days.
Layer 1
Ingestion — every source feeds in continuously
Telematics, driver mobile apps, fuel cards, maintenance sensors, and compliance logs all stream into one intake layer instead of sitting in separate systems waiting to be exported.
Layer 2
Correlation — every signal maps to one vehicle record
A single VIN becomes the anchor. Location, condition, compliance status, and cost all attach to the same record, so nobody is cross-referencing four systems by hand.
Layer 3
Rules — thresholds decide what deserves attention
Severity tiers, compliance windows, and cost baselines are configured once. The tower quietly filters normal operation from the handful of events that actually need a human.
Layer 4
Action — the right person sees it and closes it
Flagged events route to a named owner with full context attached, and the resolution feeds back into the same record, closing the loop instead of opening a new thread.
See it running on your fleet data
Watch Fragmented Signals Turn Into One Live Operating Picture
A short walkthrough is enough to show what a control tower would surface on your fleet in week one — the exceptions you are currently catching late, and the ones you are not catching at all.
What a Fleet Manager Actually Sees on the Tower
Six views make up the working surface of the control tower. Each answers one question a fleet manager currently answers by making a phone call.
View 1
Live fleet map
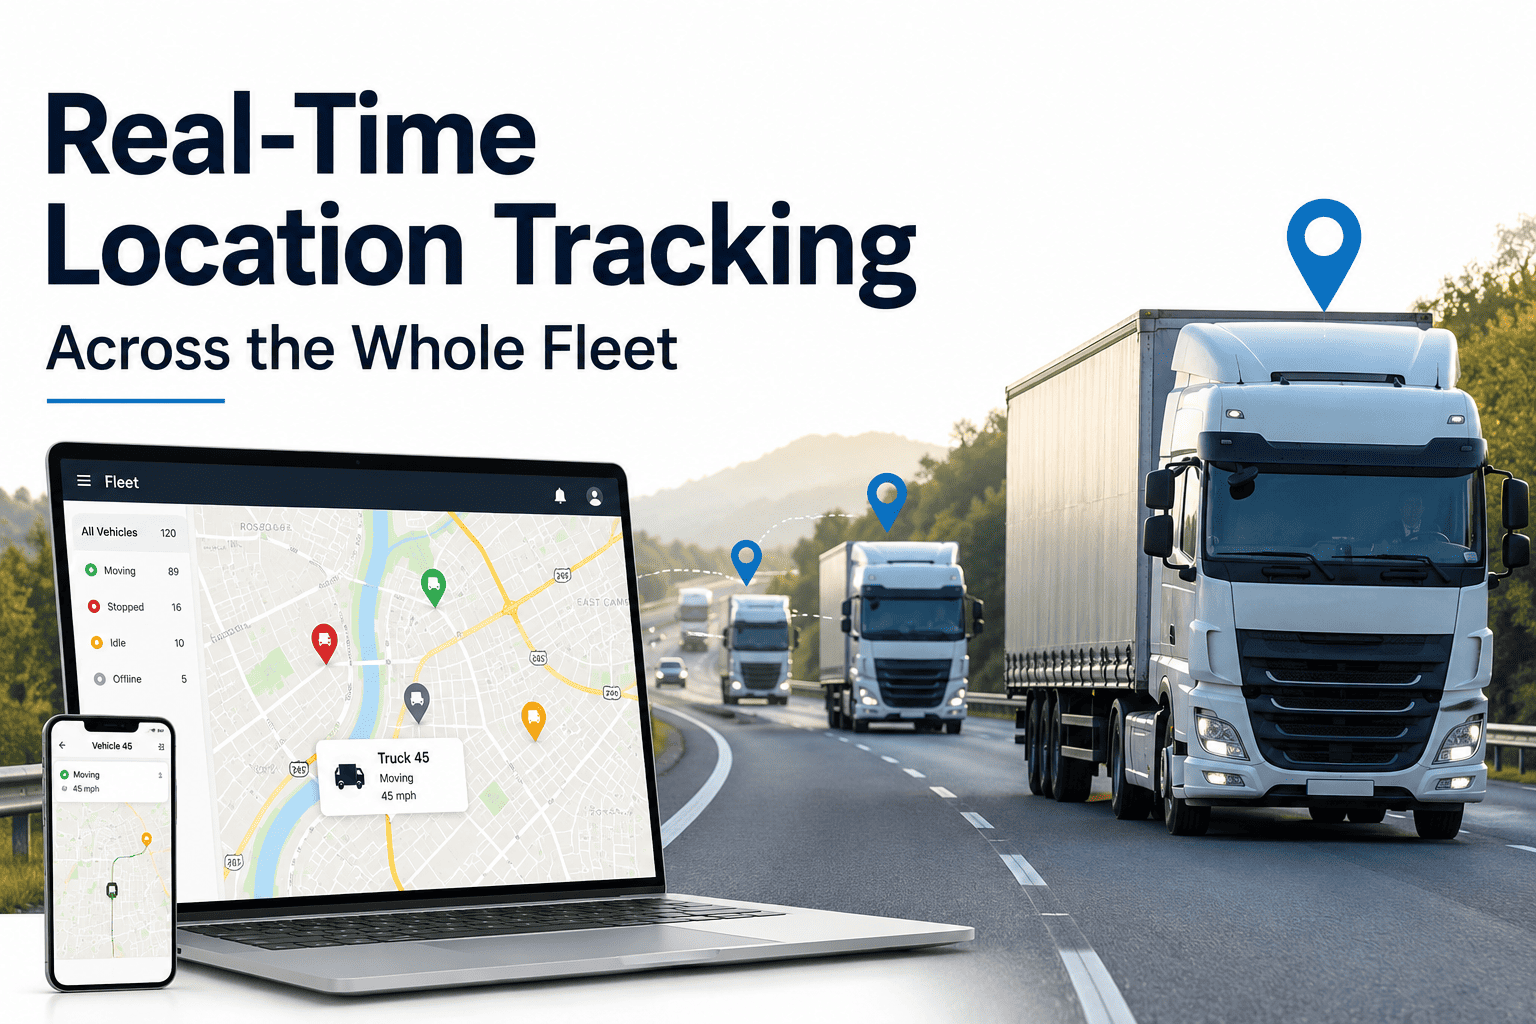
Every active vehicle plotted in real time, color-coded by status, with route deviation and idle-time flags visible at a glance.
View 2
Exception queue
Every open issue across the fleet ranked by severity, with an owner and an age-in-queue counter next to each one.
View 3
Compliance panel
Hours-of-service windows, inspection due dates, and certification expiries shown as a countdown, not a static report.
View 4
Vehicle health score
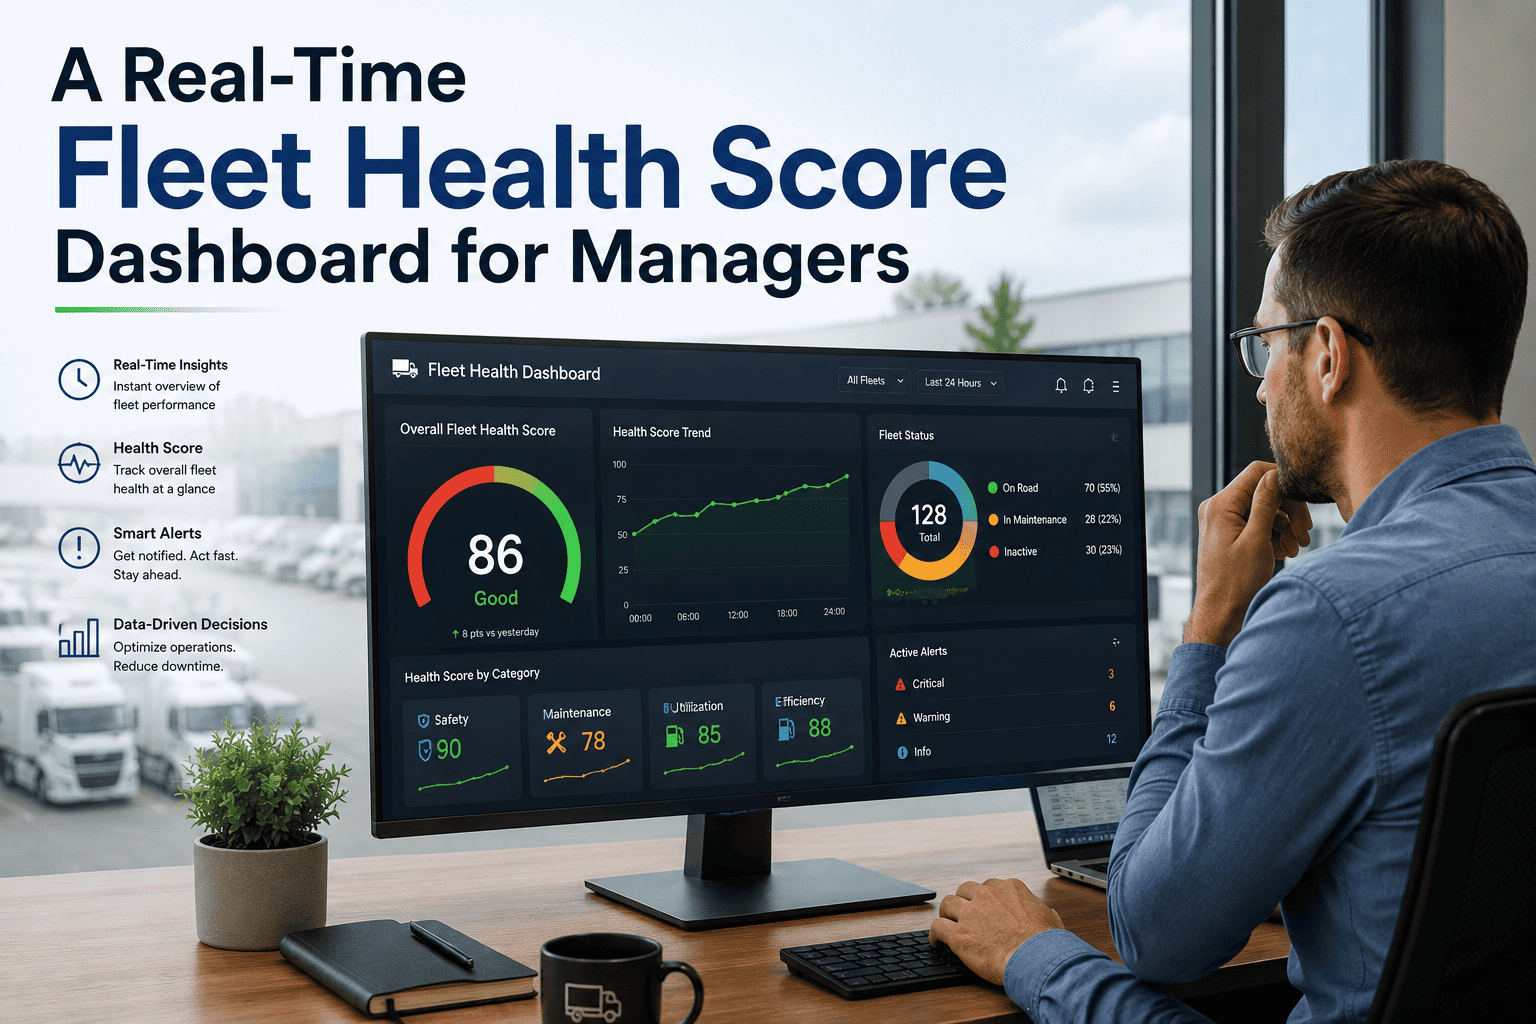
A single composite score per vehicle, built from open defects, PM status, and fault-code history, updated as new data lands.
View 5
Driver behavior feed
Harsh braking, speeding, and idle patterns surfaced by driver and by route, so coaching happens the same week, not the same quarter.
View 6
Cost-per-mile tracker
Fuel, maintenance, and downtime cost rolled up per vehicle and per route, updated daily instead of reconciled at month end.
Fragmented Tools vs a Real-Time Control Tower
The same fleet, the same vehicles, two very different operating experiences depending on whether the data is scattered or unified.
| Operational moment |
Fragmented tools |
Control tower |
| Vehicle goes off-route |
Noticed when the customer calls asking where their delivery is |
Flagged the moment the geofence is crossed |
| Driver logs a defect |
Sits in a paper form or a separate app until someone checks it |
Appears in the exception queue instantly, already prioritized |
| HOS window closing |
Discovered after the violation, during a compliance audit |
Countdown visible to dispatch before the window closes |
| Fuel cost anomaly |
Found weeks later during month-end reconciliation |
Flagged against the route baseline the same day |
| Shift handoff |
Verbal handoff, details lost between night and day teams |
Every open item stays attached to the vehicle record |
| Monthly performance review |
Days spent pulling numbers from four separate systems |
One dashboard, already reconciled, ready before the meeting |
From Signal to Action in Under Sixty Seconds
The value of a control tower is measured in how fast a single flagged event moves from detection to resolution. Here is that lifecycle, end to end.
Detect
Signal lands from telematics, driver app, or sensor
→
Score
Severity and context applied automatically
→
Route
Assigned to the right owner by role and location
→
Resolve
Action taken, closed against the vehicle record
→
Learn
Pattern feeds back into future thresholds
What Fleets Typically Recover in the First Year
Average time from event to response
6 to 10 hours
Cost visibility lag
2 to 3 weeks
Unplanned downtime per vehicle per month
14 hours
Average time from event to response, after
Under 60 seconds
Cost visibility lag, after
Same day
Unplanned downtime per vehicle per month, after
5 hours
Operational cost reduction, first year
18 to 26%
Typical payback period
5 to 8 months
KPIs a Control Tower Should Put in Front of You Daily
Target under 5 min
Time to first response on a P1 exception
How long between an alert firing and someone acting on it. Above thirty minutes, the tower is being treated as a report, not a live tool.
Target zero
Exceptions lost at shift handoff
Any open item that does not survive a shift change is a gap the tower should close automatically, not one dispatchers track by memory.
Target same day
Cost data freshness
The gap between a cost being incurred and it appearing on the dashboard. Weekly or monthly freshness means decisions are always retroactive.
Target over 90%
Compliance window visibility
Share of HOS, inspection, and certification deadlines visible to dispatch before they close, not discovered after a violation.
"
The fleets that struggle with visibility usually are not missing data. They are missing a place where that data becomes a decision before the shift ends. A control tower only earns its name when the alert reaches a person fast enough to act on it, not when it simply gets logged somewhere for a report nobody reads until the following month.
Fleet Operations Advisory Perspective
Based on patterns observed across multi-region commercial fleet deployments
One screen for the whole operation
Give Your Dispatch Team the Picture They Are Currently Assembling by Phone
Connect your telematics, maintenance, and compliance data into one control tower and see exceptions the moment they happen, not the moment someone reports them.
Frequently Asked Questions
Q1. How is a control tower different from a regular fleet dashboard?
A dashboard summarizes what already happened. A control tower correlates live signals across telematics, maintenance, and compliance so exceptions surface and route to an owner within seconds.
Book a demo to see the difference on your own fleet data.
Q2. Do we need to replace our existing telematics provider?
No. The control tower sits on top of your existing telematics, fuel card, and compliance tools through API integration, so the sources stay the same and only the visibility layer changes.
Q3. How long does it take to get a working control tower live?
A single-region pilot connecting core data sources typically goes live in two to four weeks, with the full multi-region rollout following once the pilot's numbers are proven.
Q4. What happens to alerts that do not get resolved quickly?
Unresolved exceptions age visibly in the queue and escalate automatically past a configured threshold, so nothing sits unattended past a shift change.
Start a free trial to configure escalation rules against your team structure.
Q5. Is this only useful for large multi-region fleets?
Smaller single-site fleets see the same benefit at a smaller scale — the value comes from closing the gap between an event happening and someone seeing it, regardless of fleet size.
Real-time visibility, built for how fleets actually run
Stop Reconstructing What Happened. Start Watching What Is Happening.
Oxmaint's control tower brings telematics, maintenance, compliance, and cost data into one live operating picture, so your team acts on exceptions in seconds instead of piecing them together after the fact.