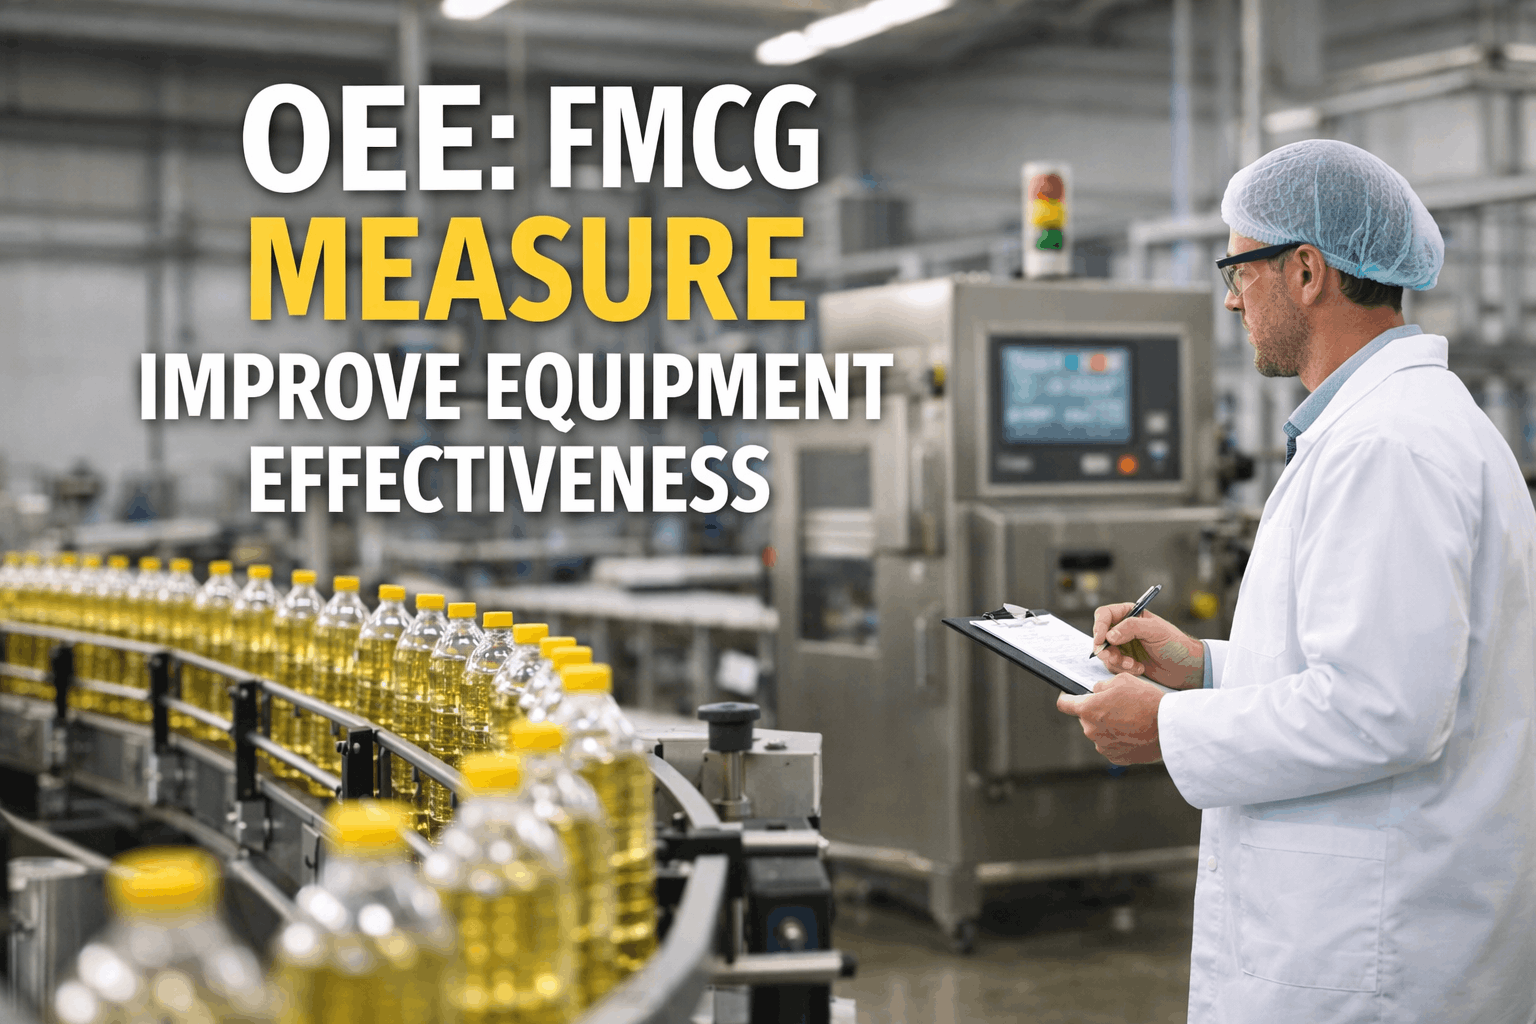
In FMCG manufacturing, Overall Equipment Effectiveness is the single number that tells you exactly how much of your potential production capacity you are actually using — and most plants are losing between 32% and 47% of that capacity every day without realizing it. The average FMCG line runs at 53% to 68% OEE, while world-class plants operate above 85%. That gap is not a mystery — it is a measurable, closeable performance problem. Start a free trial and track OEE across every production line from day one, or book a demo to see how Oxmaint surfaces the real losses on your lines.
53–68%
Average FMCG OEE
vs. 85% world-class target
$3,000+
Cost Per Minute
of unplanned production downtime
42%
Downtime From Equipment
leading cause of FMCG line stoppages
+15%
OEE Gain Possible
with real-time monitoring and planned PM
Your OEE score is costing you production capacity right now
Oxmaint gives FMCG plant managers real-time OEE dashboards, automated downtime capture, and AI-driven maintenance triggers — all connected to your asset registry and work order system.
What Is OEE and Why Does It Matter in FMCG?
OEE — Overall Equipment Effectiveness — is the industry-standard metric that measures how well production equipment is utilized compared to its full potential. It combines three distinct performance factors into a single percentage score that instantly reveals where production capacity is being lost. In FMCG manufacturing, where margins are thin, SKU complexity is high, and changeovers are frequent, OEE is not a reporting exercise — it is the operational heartbeat of a competitive plant.
FMCG OEE Benchmarks by Sub-Sector
Not all FMCG lines are equal. Beverages have different constraints than snack foods or personal care. Knowing where your sub-sector sits is the first step to setting a realistic improvement target — and identifying where you are underperforming peers.
The 6 Big Losses Destroying Your OEE Score
The OEE framework identifies six specific categories of production loss — known as the "6 Big Losses." Every FMCG plant has all six. The ones you do not measure are the ones that cost the most. Most plants can recover 10 to 20 OEE points just by making these visible.
Availability Loss
Breakdowns
Unplanned equipment failures that halt production completely. Typically the highest-impact single loss category, averaging 8–14% of planned production time in food plants without predictive maintenance.
Availability Loss
Setup & Changeover
Time lost between SKU changeovers, line cleaning, and format adjustments. In high-variety FMCG environments, changeover losses alone can consume 10–18% of available production time.
Performance Loss
Minor Stoppages
Short, frequent interruptions under 10 minutes — jams, sensor faults, misfeeds — that are individually small but collectively account for 15–25% of total FMCG production losses across high-speed packaging lines.
Performance Loss
Reduced Speed
Running equipment below its nameplate speed due to quality concerns, material issues, or unmaintained components. Even a 10% speed reduction on a high-output line compounds into significant annual output loss.
Quality Loss
Startup Rejects
Products made out-of-spec during line startup or after a changeover while the process stabilizes. Food lines generating 2–4% startup waste per changeover — multiplied across dozens of daily SKU switches — lose significant yield.
Quality Loss
Production Defects
Units rejected in steady-state production due to fill weight variation, seal failure, label misalignment, or contamination. A 1% steady-state defect rate on a 300-unit-per-minute line equals 4,320 wasted units per shift.
Reactive vs. Data-Driven OEE Management
Most FMCG plants still manage OEE the traditional way — logging downtime manually after the fact, running weekly reports from spreadsheets, and reacting to problems after they have already cost production. Data-driven plants using real-time OEE platforms operate in a completely different mode. The gap in outcomes is stark.
| Factor |
Reactive / Manual |
Oxmaint Real-Time |
| OEE Visibility |
Weekly report, after the fact |
Live dashboard per line, per shift |
| Downtime Capture |
Manual operator log (often incomplete) |
Automated with reason coding |
| Minor Stop Tracking |
Invisible — not logged |
Auto-detected and categorized |
| Changeover Optimization |
No baseline data |
SMED tracking vs. target time |
| Maintenance Trigger |
On failure or fixed schedule |
Condition-based, production-triggered |
| Quality Correlation |
Manual — slow to diagnose |
OEE linked to asset health score |
| Plant Manager Action |
Responding to yesterday's problems |
Preventing tomorrow's failures today |
| Benchmark Comparison |
No cross-site comparison |
Portfolio-level OEE benchmarking |
How Oxmaint Drives OEE Improvement in FMCG Plants
Oxmaint is built for exactly the operational complexity FMCG plant managers deal with daily — multi-line environments, high changeover frequency, GMP compliance requirements, and pressure to push throughput without sacrificing quality. Every feature is tied directly to an OEE improvement lever. Want to see this live? Start a free trial or book a demo with our FMCG operations team.
Availability
Real-Time OEE Dashboards
Live line-level OEE updated every cycle, with automated downtime reason capture. Shift managers see exactly what is happening, not what happened 24 hours ago.
Availability
Preventive Maintenance Scheduling
PM tasks triggered by production counts, run hours, and cycle data — not just calendar dates. Reduces breakdown-driven downtime by up to 35% within the first 90 days.
Performance
Minor Stop Detection
IoT and SCADA integration captures micro-stops automatically. Pareto analysis surfaces the top stop causes per line — giving maintenance teams a prioritized fix list, not a vague feeling.
Performance
Changeover Management
Digital changeover checklists with time tracking versus SMED targets. Average FMCG plants reduce changeover time by 18–22% within 60 days of structured changeover monitoring.
Quality
Asset Condition Scoring
Each asset carries a live condition score linked to its maintenance history, sensor data, and inspection records. Deteriorating condition scores correlate directly to quality deviation events.
Quality
Digital Equipment Inspections
GMP-compliant inspection records with digital sign-off, automated escalation on failed checks, and full audit trail. Every quality deviation tied back to equipment health status.
OEE Improvement Results: What Plants Achieve
+8–15%
OEE Points Gained
Within 6 months of deploying real-time OEE monitoring and condition-based maintenance in FMCG plants
35%
Fewer Breakdowns
Average reduction in unplanned stoppages when PM scheduling is tied to production data rather than calendar schedules
18–22%
Faster Changeovers
Typical changeover time reduction through SMED-based digital tracking and structured improvement cycles
11 months
Average ROI Breakeven
Typical time to full ROI from combined downtime reduction, maintenance cost savings, and increased throughput
Frequently Asked Questions
What is a good OEE score for an FMCG manufacturing plant?
Industry averages in FMCG range from 53% to 68% depending on the sub-sector. A score above 75% is considered strong for most food and consumer goods environments. World-class performance is defined as 85% or above — though given mandatory sanitation cycles and changeover requirements in FMCG, 78–82% is a highly competitive realistic target for most plants.
What causes the biggest OEE losses in food manufacturing?
The three largest OEE loss drivers in food manufacturing are unplanned equipment breakdowns (accounting for roughly 42% of downtime incidents), changeover and setup time losses (often 10–18% of planned production time), and minor stoppages on high-speed packaging lines (15–25% of total losses in many facilities). Most plants undercount stopaages because sub-10-minute stops are rarely logged manually.
How do you calculate OEE in FMCG manufacturing?
OEE is calculated by multiplying Availability (actual run time / planned production time) by Performance (actual output rate / ideal output rate) by Quality (good units / total units produced). For example, a line running at 85% availability, 90% performance, and 95% quality delivers an OEE of 72.7%. Each factor points to a different category of loss to address.
How quickly can OEE improve after implementing real-time monitoring?
Most FMCG plants see measurable OEE improvement within 30–60 days of deploying real-time OEE monitoring — simply because visibility creates accountability. The first gains come from minor stopage elimination and changeover standardization. Sustained 8–15 point OEE improvements are typically achieved within 6 months when monitoring is combined with condition-based maintenance scheduling.
Close the gap between your current OEE and world-class performance
Oxmaint's FMCG production platform gives plant managers real-time OEE visibility, automated downtime capture, condition-based maintenance, and line-level improvement analytics — without a six-month implementation project. Join FMCG plants already running measurably more efficient production lines.


-in-fmcg-calculation,-benchmarks-&-improvement.png)