Ask a maintenance manager how reliable the sanitation line is and you'll usually get a feeling, not a number. Ask the same question about a filler, a packaging line, and a refrigeration compressor, and the feeling changes for each — but nobody wrote down why. Sign up to turn MTBF and MTTR into a real baseline for every equipment category, tracked automatically instead of estimated from memory.
What This Guide Covers
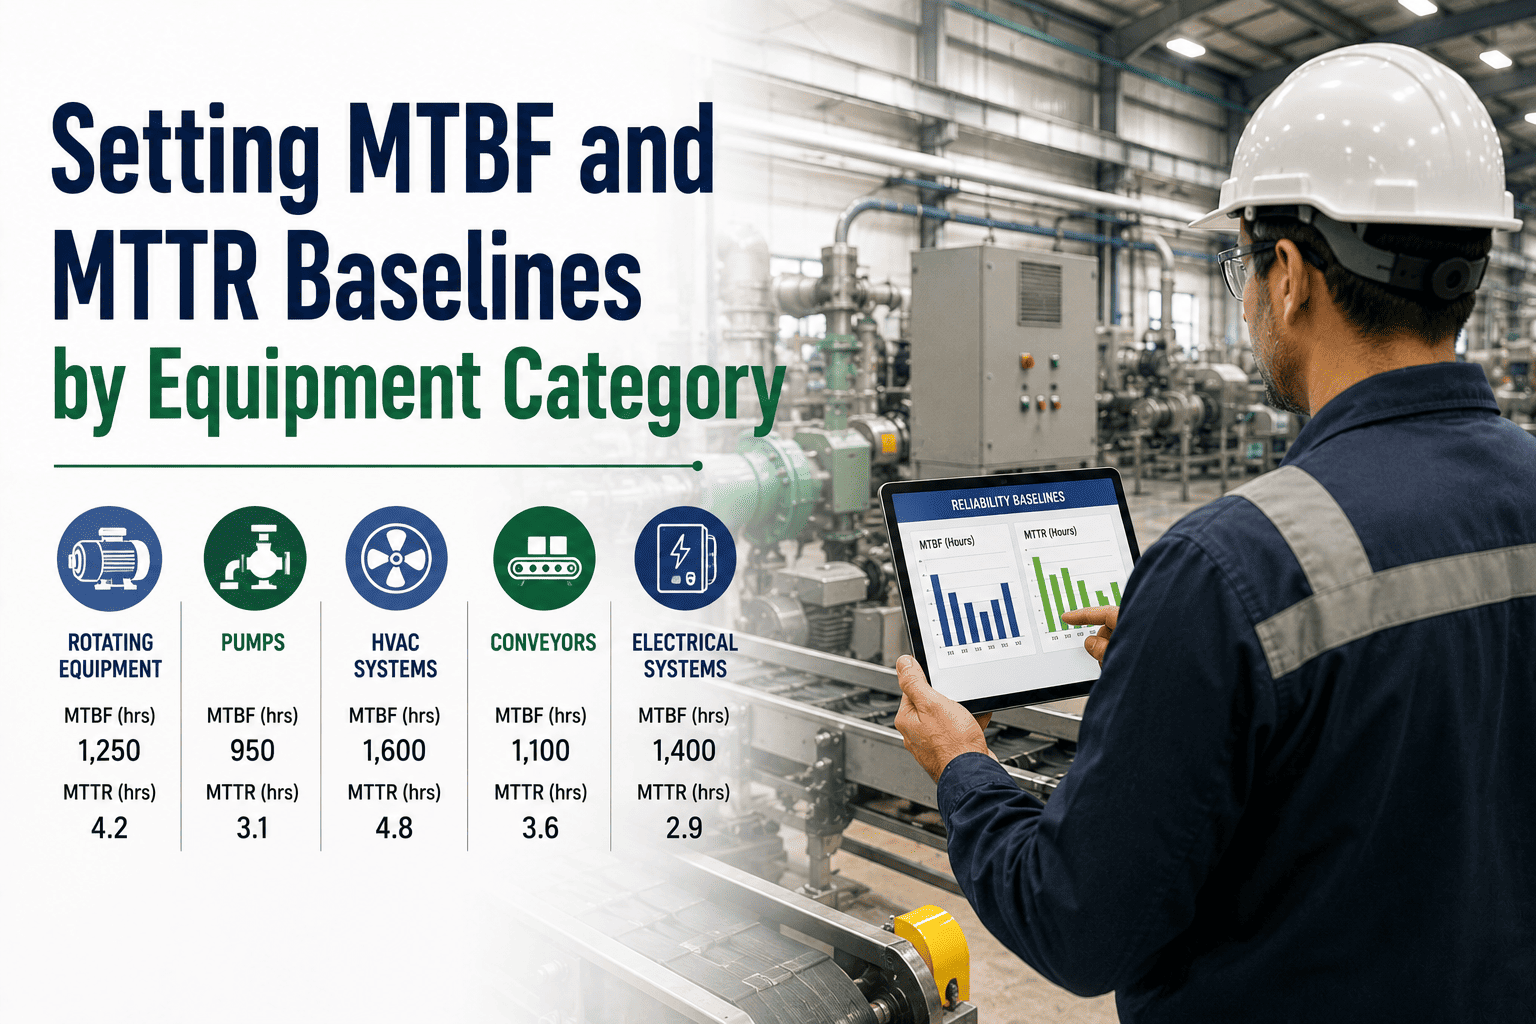
Setting MTBF and MTTR baselines by equipment category means measuring failure frequency and repair time separately for each asset class, instead of one plant-wide average that hides where reliability is actually strong or weak. This guide covers the baseline methodology, target setting, driver analysis, and the CMMS analytics that make MTBF and MTTR numbers leadership can act on.
The Two Numbers, In Plain Terms
MTBF — Mean Time Between Failures
Total operating time divided by number of failures. It answers: how long does this equipment typically run before something breaks?
MTTR — Mean Time To Repair
Total repair time divided by number of repairs. It answers: once something breaks, how long until it's running again?
Why One Plant-Wide Average Hides The Truth
| Equipment Category |
What Drives Its Baseline |
| Fillers and packaging lines |
High cycle counts mean failures are frequent but usually quick to clear, so MTBF runs lower and MTTR lower too |
| Refrigeration and compressors |
Failures are less frequent but repairs often need specialized parts or technicians, pushing MTTR higher |
| Sanitation and CIP systems |
Daily wash-down cycles create a distinct wear pattern that a general equipment baseline won't reflect |
| Material handling and conveyors |
Mechanical wear accumulates gradually, so MTBF trends matter more than any single failure event |
Setting Baselines That Actually Hold Up
1
Group Assets By Category Before Calculating Anything
A baseline is only meaningful when it's compared to equipment that fails and gets repaired in similar ways
2
Pull From Clean Work Order Data, Not Estimates
MTBF and MTTR are only as accurate as the timestamps behind them — failure start, repair start, and restart all need to be logged consistently
3
Set Targets Per Category, Not One Plant-Wide Number
A filler and a compressor should never be judged against the same MTTR target — set realistic goals for each equipment class
4
Analyze Drivers Before Chasing The Number
A falling MTBF might mean worn parts, a missed PM step, or an operator practice — the number tells you where to look, not why
5
Revisit Baselines As The Fleet Ages Or Changes
A baseline set at commissioning won't hold five years later — trend it and update it on a schedule
Reliability Metrics That Calculate Themselves
OxMaint pulls MTBF and MTTR straight from your work order history, broken out by equipment category automatically. Sign up for a free trial to see your real baselines, or book a demo to walk through the analytics with your team.
What CMMS Analytics Adds To The Picture
Automatic Category Rollups
MTBF and MTTR calculate themselves by asset class as work orders close, with no manual spreadsheet math
Trend Lines, Not Snapshots
A slipping baseline shows up as a trend weeks before it becomes a pattern of downtime
Failure Mode Tagging
Each closed work order carries a failure code, so driver analysis doesn't start from a blank page
Leadership-Ready Reporting
Category-level dashboards turn reliability from a maintenance conversation into a plant performance metric
A Falling MTBF Is A Question, Not A Verdict
A dropping MTBF on one equipment category doesn't automatically mean bad maintenance — it could be aging assets, a supplier change in parts, or a shift in production demand. Tracking the number by category is what makes the question answerable instead of buried in a plant-wide average that stays flat while one line quietly deteriorates.
Frequently Asked Questions
Q
Why not just track one MTBF and MTTR number for the whole plant?
A plant-wide average blends fast-cycling packaging equipment with slow-failing refrigeration systems, which flattens the number until it stops telling you anything useful about where reliability is actually improving or slipping.
Q
How much history is needed before a baseline is reliable?
Enough failure and repair events to smooth out one-off outliers — for most categories that means several months of consistent, clean work order data rather than a single quarter.
Q
Is a high MTTR always a problem?
Not automatically. A category with specialized parts or technicians, like refrigeration, will naturally run a higher MTTR than a filler line — the target should reflect that category's realistic repair path, not a plant-wide standard.
Turn Reliability From A Guess Into A Metric
OxMaint tracks MTBF and MTTR by equipment category automatically, so you know exactly where reliability is holding and where it's slipping. Sign up for a free trial to see your baselines today, or book a demo to see the full analytics workflow.