Food plants that track maintenance KPIs systematically reduce unplanned downtime by 35-45% within the first year — yet 62% of food manufacturers still rely on spreadsheets or paper logs that are outdated before the shift ends. The gap between knowing your OEE and actually using it to prevent the next line shutdown is a CMMS dashboard that connects real-time data to real-time decisions. Start a free trial with Oxmaint and build your food plant KPI dashboard in under 60 minutes — or book a demo to see how real-time maintenance analytics drive audit-ready performance.
KPI Dashboard · OEE · MTTR · PM Compliance · Food Safety Analytics
If You Cannot Measure It,
You Cannot Improve It.
And You Definitely Cannot Audit It.
Maintenance KPIs in food manufacturing are not vanity metrics. They are the difference between passing a GFSI audit and shutting down a production line. Between a 78% OEE and a world-class 85%. Between reactive firefighting and a maintenance team that prevents failures before they contaminate product. This guide breaks down the metrics that matter, the benchmarks to target, and how to build a dashboard that drives action.
Oxmaint's CMMS dashboard tracks every KPI in this guide automatically — OEE, MTTR, MTBF, PM compliance, audit readiness, and cost per unit — with zero manual data entry from your maintenance team.
85%
World-Class OEE Target
Top food plants achieve 85%+ OEE while the industry average sits at 60-65% — a gap worth millions in lost production
62%
Still Using Spreadsheets
Of food manufacturers track maintenance data manually, creating blind spots in performance and compliance reporting
4.8x
Emergency Cost Premium
Unplanned reactive repairs cost 4.8x more than scheduled maintenance — a metric most plants never quantify until they start tracking it
90%+
PM Compliance Target
Food plants below 90% PM compliance see 2-3x higher unplanned downtime and significantly increased audit finding rates
The Foundation
What Are Food Plant Maintenance KPIs — And Why Are They Different?
Maintenance KPIs in food manufacturing carry a dual burden that general manufacturing does not face. Every metric must satisfy two masters: production efficiency and food safety compliance. An OEE number that looks acceptable can still hide a hygiene failure. A fast MTTR that gets the line running again can mask a sanitation shortcut that triggers a recall. Food plant KPIs must track both speed and safety — simultaneously, in real time, with audit-ready documentation. That is why generic maintenance dashboards fail in food environments. You need metrics designed for facilities where a missed PM can result in contaminated product reaching the consumer. Want to see what a food-specific KPI dashboard looks like in practice? Start a free trial and explore Oxmaint's pre-built food plant analytics — or book a demo to walk through a live dashboard configured for food manufacturing.
Production Efficiency
Uptime and Output Metrics
OEE, MTBF, MTTR, and production throughput measure how effectively your maintenance program keeps lines running and product flowing. These are the metrics your operations team watches daily.
Food Safety Compliance
Hygiene and Audit Metrics
PM compliance rate, sanitation cycle completion, environmental monitoring adherence, and CIP system validation frequency. These are the metrics your auditor will ask for — with timestamps.
Cost Intelligence
Maintenance Spend Analytics
Maintenance cost per unit produced, reactive vs. planned spend ratio, spare parts carrying cost, and cost avoidance from prevented failures. These metrics justify your budget and prove ROI to leadership.
Workforce Performance
Team Efficiency Metrics
Work order completion rate, wrench time percentage, technician utilization, and training compliance. These metrics show whether your team is fighting fires or preventing them — and whether they are qualified for both.
Core KPIs
The 8 Maintenance KPIs Every Food Plant Must Track
Not all metrics are equal. These eight KPIs form the operational backbone of a data-driven food plant maintenance program. Each one connects directly to either production output, food safety compliance, or maintenance cost — most connect to all three. Tracking fewer than these eight leaves dangerous blind spots in your operation. Track more than twelve and your team drowns in data without acting on it. These eight represent the actionable middle ground. If your dashboard does not show all eight in real time, you are running your plant partly blind — start a free trial to see all eight KPIs populated automatically from work order data.
01
Overall Equipment Effectiveness (OEE)
Availability x Performance x Quality
Target: 85%+ (World Class) | Food Industry Avg: 60-65%
OEE is the single most comprehensive production metric. In food plants, it captures not just mechanical uptime but also changeover losses, speed derating during sanitation, and quality rejections from equipment-related defects. A 1% OEE improvement on a $50M production line is worth $500K annually.
02
Mean Time Between Failures (MTBF)
Total Operating Time / Number of Failures
Target: Trending upward quarter over quarter
MTBF is your reliability indicator. In food plants, declining MTBF on a filler, heat exchanger, or conveyor signals that your PM program is not catching degradation before failure — and every unplanned stop on a food line risks product exposure, contamination, and batch rejection.
03
Mean Time To Repair (MTTR)
Total Repair Time / Number of Repairs
Target: Under 2 hours for critical food line assets
Every hour of MTTR on a food production line has a triple cost: lost production output, product at risk in partially processed state, and potential sanitation protocol restart. Reducing MTTR by 30 minutes across all critical assets can recover 200+ production hours per year.
04
PM Compliance Rate
PMs Completed On Time / PMs Scheduled x 100
Target: 90%+ | Best-in-class: 95%+
PM compliance below 90% in food manufacturing is an audit risk, not just an operational inefficiency. GFSI auditors check PM completion records. Every missed PM is a documented gap that an auditor can cite — and in food safety, documented gaps have consequences.
05
Planned vs. Reactive Maintenance Ratio
Planned Work Orders / Total Work Orders x 100
Target: 80%+ planned | Industry Avg: 55% planned
The single clearest indicator of maintenance program maturity. Plants running above 80% planned maintenance spend 30-40% less on maintenance overall and experience 3x fewer food safety incidents linked to equipment failure.
06
Maintenance Cost Per Unit Produced
Total Maintenance Cost / Units Produced
Target: Declining trend, benchmark against peers
This metric normalizes maintenance spend against production volume — so seasonal spikes and capacity changes do not distort cost visibility. Food plants achieving best-in-class ratios typically spend 2-4% of replacement asset value on annual maintenance.
07
Work Order Backlog (Weeks)
Open Work Order Hours / Weekly Available Labor Hours
Target: 2-4 weeks of backlog | Red flag: 6+ weeks
Backlog above 6 weeks means your team is structurally understaffed or your PM program generates more work than your team can execute. In food plants, excessive backlog means deferred sanitation-related PMs — a direct food safety risk that auditors will flag.
08
Audit Readiness Score
Complete Records / Total Required Records x 100
Target: 100% | Every missing record is a finding
In food manufacturing, audit readiness is not optional — it determines whether you keep your customers, your certifications, and your license to operate. A CMMS that auto-generates timestamped, signed inspection records eliminates the frantic pre-audit scramble that 78% of food plants still endure.
Pain Points
Why Most Food Plant Maintenance Dashboards Fail
Having KPIs is not the same as using them. Most food plants collect some data, display some charts, and change nothing. The dashboard exists. The behavior does not. Here are the four failure modes that turn maintenance analytics into expensive decoration. If any of these sound familiar, it is time to rethink your dashboard architecture — book a demo to see how Oxmaint's dashboards are built to drive action, not just display data.
Data Entry Kills Accuracy
When technicians must manually log data into spreadsheets or standalone systems, 30-40% of maintenance activities go unrecorded. Your KPIs are calculated from incomplete data — and incomplete data drives wrong decisions. Dashboards built on manual entry are dashboards built on fiction.
Delayed Visibility Creates False Confidence
Weekly or monthly KPI reports show you what happened — not what is happening. By the time a PM compliance dip appears in a monthly report, 30 days of missed preventive maintenance has already accumulated into reliability risk and audit exposure.
Metrics Without Benchmarks Are Meaningless
An OEE of 72% sounds reasonable until you learn that your peer group averages 78% and world-class plants hit 85%. Without industry benchmarks and internal trending, your team has no idea whether 72% represents good performance or a $2M annual production gap.
No Link Between KPI and Action
The most common dashboard failure: data is displayed but no workflow is triggered. When MTBF drops below threshold, who gets notified? When PM compliance falls to 85%, what work orders are auto-prioritized? A dashboard without automated response is a wall decoration.
Dashboard Comparison
Spreadsheet Tracking vs. CMMS-Powered KPI Dashboard
| Capability |
Manual Spreadsheet Tracking |
Oxmaint CMMS Dashboard |
| Data Freshness |
Weekly or monthly manual updates — always lagging |
Real-time — every work order completion updates KPIs instantly |
| OEE Calculation |
Manual formula entry, error-prone, averaged across weeks |
Auto-calculated per line, per shift, with drill-down to loss categories |
| PM Compliance |
Counted manually — overdue PMs easily missed or miscounted |
Auto-tracked with overdue alerts and escalation workflows |
| Audit Documentation |
Scattered files, missing timestamps, no digital signatures |
Audit-ready reports generated in seconds with full traceability |
| Cross-Plant Benchmarking |
Impossible without standardized data collection |
Unified metrics across all sites with automatic benchmarking |
| Technician Accountability |
No visibility into who did what, when, or how long it took |
Full technician history — time stamps, photos, parts used, digital sign-off |
Oxmaint Solution
How Oxmaint Turns Food Plant Data Into Actionable KPI Dashboards
Oxmaint does not just display metrics — it connects them to the work orders, asset records, and compliance documentation that make them real. Every KPI on your dashboard is backed by traceable data that your auditor can verify and your operations team can act on. No manual data entry. No spreadsheet reconciliation. No fiction. Just operational truth, updated in real time. Start a free trial and see your first KPI dashboard populate from real work order data.
OEE Tracking
Line-Level OEE Dashboard
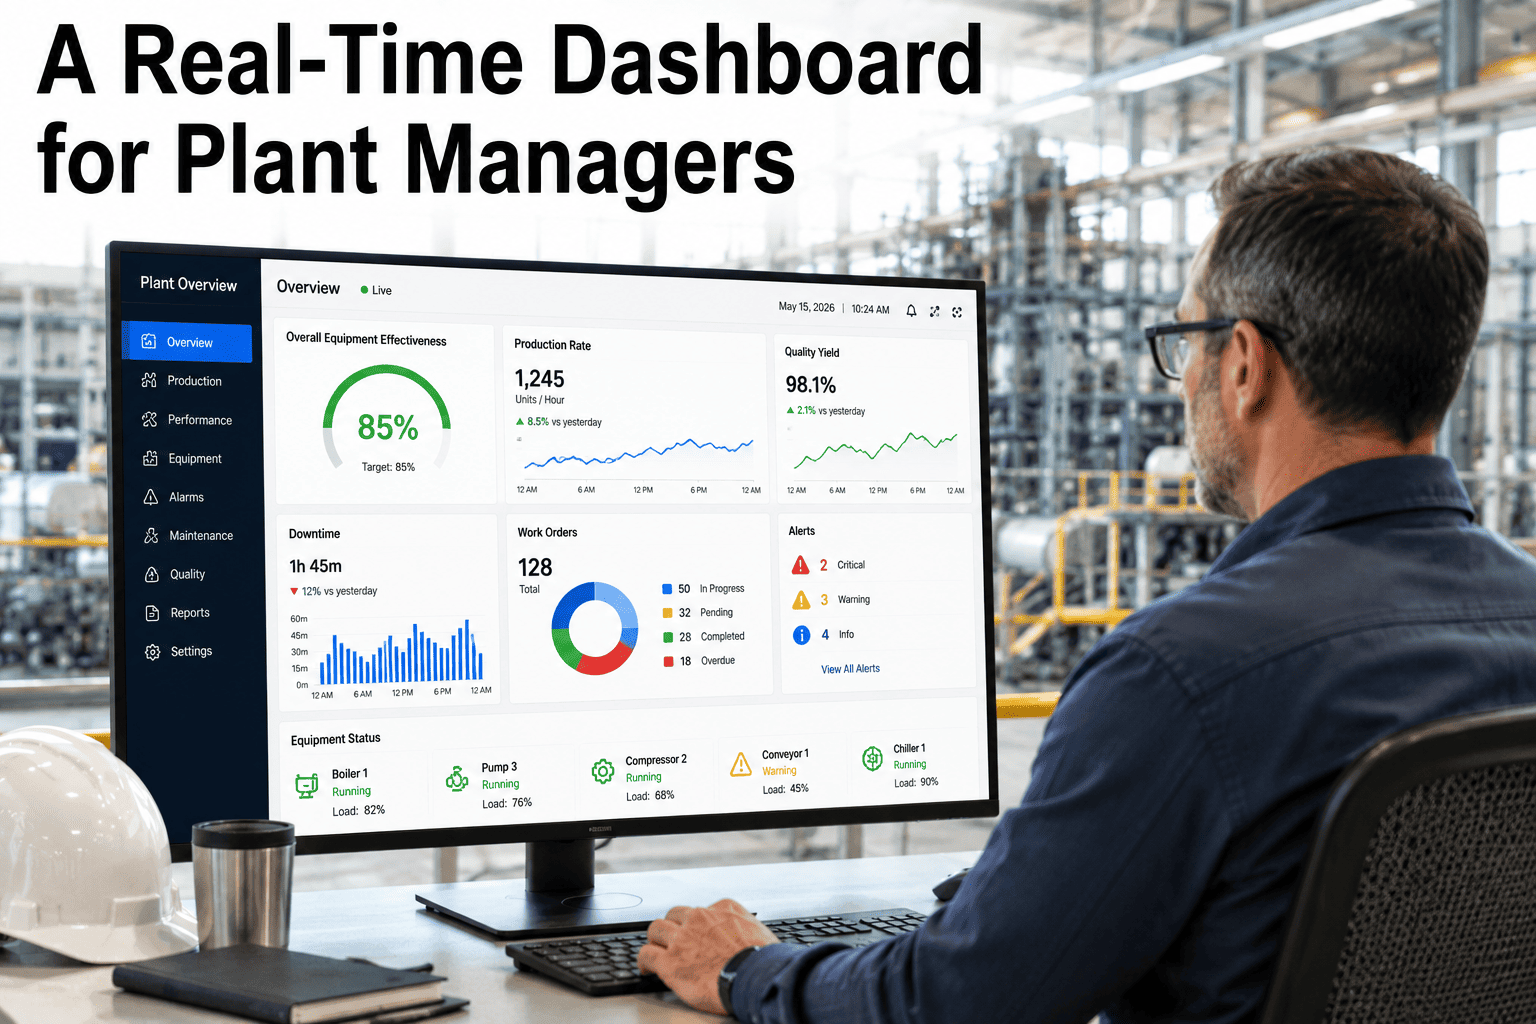
Track OEE per production line, per shift, and drill down into availability, performance, and quality loss categories. Identify whether downtime is caused by equipment failure, changeover, or sanitation — and quantify the production impact of each.
PM Analytics
Compliance Rate Monitoring
Real-time PM compliance tracking with automatic overdue alerts, escalation workflows, and trend analysis. When compliance drops below your threshold, the system notifies the maintenance manager and auto-prioritizes the overdue work orders.
Cost Intelligence
Maintenance Cost Analytics
Track cost per unit produced, reactive vs. planned spend ratio, and cost avoidance from prevented failures — all calculated automatically from work order data. Your next budget conversation is backed by data, not estimates.
Reliability Metrics
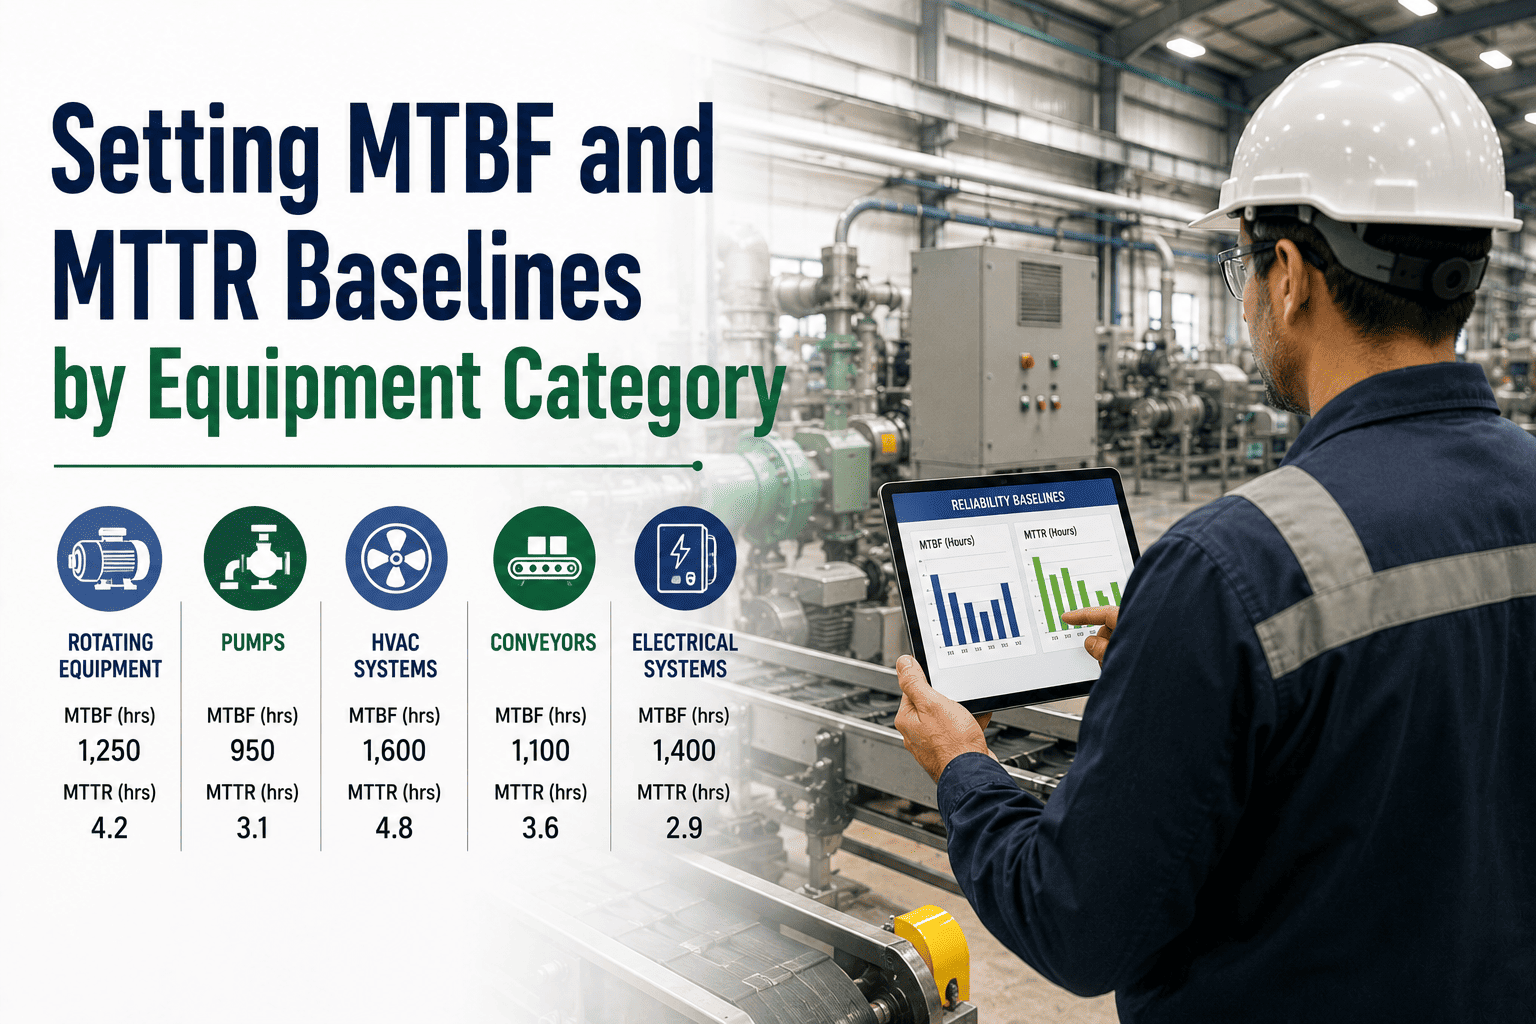
MTBF and MTTR Trending
Every asset carries live MTBF and MTTR scores updated from work order history. When MTBF drops below baseline, the asset is automatically flagged for root cause analysis — catching reliability decline before it causes a production-impacting failure.
Audit Readiness
Compliance Documentation Engine
Generate GFSI, SQF, and BRC audit-ready maintenance reports in seconds. Every PM completed, every inspection recorded, every corrective action documented — with digital signatures, timestamps, and photo evidence attached automatically.
Portfolio View
Multi-Site KPI Comparison
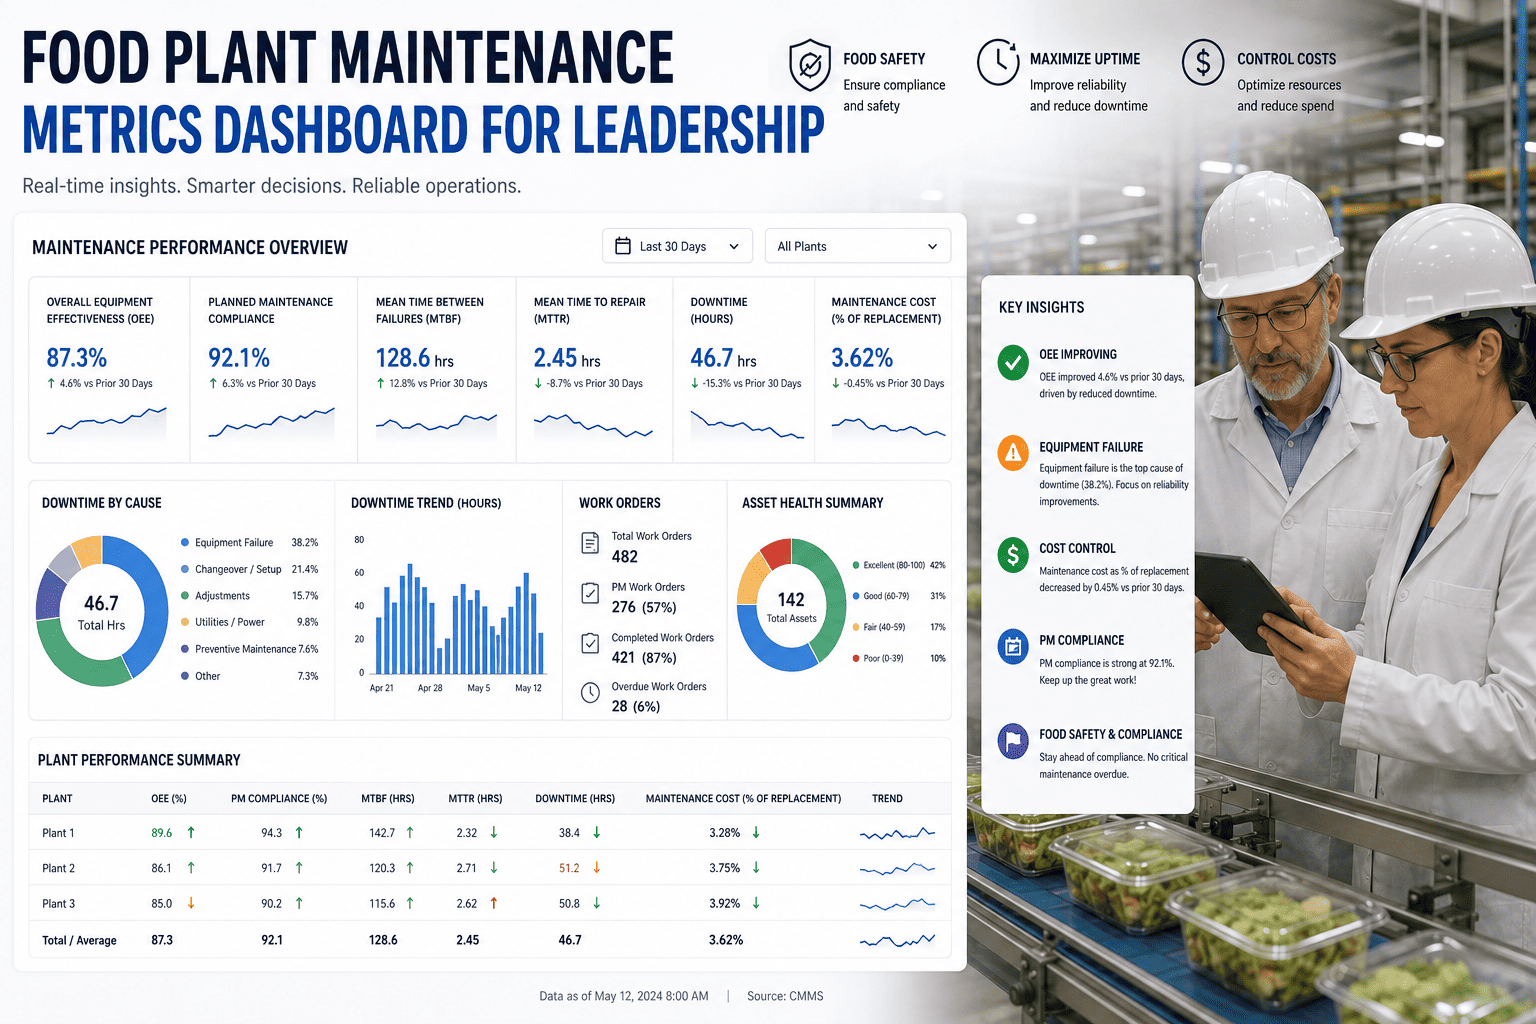
Compare OEE, MTTR, PM compliance, and maintenance cost across all your food plants from a single dashboard. Identify which sites are leading, which are lagging, and where to focus improvement resources for maximum portfolio-level ROI.
Performance Tiers
Food Plant Maintenance KPI Benchmarks — Where Does Your Plant Stand?
Use these benchmarks to assess your current maintenance program maturity. Plants in the "Reactive" tier are spending 30-50% more on maintenance than plants in the "Optimized" tier — while experiencing 3-5x more food safety incidents linked to equipment failure.
Reactive
OEEBelow 60%
PM ComplianceBelow 70%
Planned RatioBelow 40%
MTTR4+ hours
High audit risk. Frequent product holds. Emergency repairs consuming 60%+ of maintenance budget.
Developing
OEE60-72%
PM Compliance70-85%
Planned Ratio40-65%
MTTR2-4 hours
Some PM structure in place but inconsistent execution. Audits pass with findings. Improvement potential: 15-25% cost reduction.
Proactive
OEE72-82%
PM Compliance85-93%
Planned Ratio65-80%
MTTR1-2 hours
Solid PM program with CMMS-driven execution. Audits pass cleanly. Improvement potential: 10-15% further cost optimization.
Optimized
OEE85%+
PM Compliance95%+
Planned Ratio80%+
MTTRUnder 1 hour
Data-driven maintenance with predictive capabilities. Audit-ready at all times. Maintenance is a competitive advantage, not a cost center.
ROI Impact
The Financial Impact of KPI-Driven Maintenance in Food Plants
35%
Reduction in Unplanned Downtime
Food plants that implement CMMS-driven KPI dashboards reduce unplanned downtime by 35-45% within 12 months of deployment — recovering production hours worth 10-20x the software investment
$180K
Average Annual Savings Per Plant
The combination of reduced emergency repairs, optimized spare parts, extended asset life, and improved labor utilization averages $180K in annual savings for mid-size food manufacturing facilities
78%
Faster Audit Preparation
Plants with CMMS-generated compliance documentation reduce audit preparation time by 78% — from weeks of scrambling to minutes of report generation. No more overtime pulling records.
92%
KPI Accuracy Improvement
Automated data capture from work order completion eliminates the 30-40% data gap that manual tracking creates — giving your team decisions based on complete, accurate operational data
Expert FAQ
Food Plant Maintenance KPI Dashboard — Common Questions
Which KPIs should a food plant maintenance team start tracking first?
Start with PM compliance rate and planned vs. reactive ratio — these two metrics are both the easiest to implement and the most immediately actionable. PM compliance directly impacts food safety audit outcomes, so improvement here has dual value: operational and regulatory. Once those are stable above 85%, layer in OEE tracking at the line level and MTTR monitoring on critical assets. Trying to track all eight KPIs simultaneously before your data infrastructure is solid creates noise without insight.
Start a free trial and begin tracking PM compliance in your first week.
How does OEE tracking differ in food manufacturing compared to general manufacturing?
Food plant OEE must account for sanitation downtime, CIP cycle duration, allergen changeover time, and quality losses specifically from contamination or temperature deviations — none of which exist in general manufacturing. A food plant with 72% OEE may actually be performing well if sanitation protocols consume 15% of available time by design. The key is separating planned sanitation losses from unplanned equipment failures — and tracking both categories independently. Oxmaint's OEE module categorizes downtime by type, so your team knows exactly where production time is going.
Book a demo to see food-specific OEE categorization in action.
What PM compliance rate do GFSI auditors actually expect?
While there is no universal numerical requirement written into SQF, BRC, or FSSC 22000 standards, auditors consistently expect documented evidence that preventive maintenance is executed on schedule for food-contact equipment. In practice, plants below 85% PM compliance receive audit findings related to maintenance program effectiveness. Plants at 90%+ typically pass clean. The critical factor is not just the percentage — it is the documentation trail. A CMMS that generates timestamped completion records with digital technician signatures satisfies auditor requirements far more effectively than paper logs or spreadsheet summaries.
Start your free trial and generate audit-ready PM compliance reports automatically.
Can Oxmaint benchmark our food plant KPIs against industry peers?
Oxmaint provides internal benchmarking across your own multi-site portfolio — comparing OEE, MTTR, PM compliance, and maintenance cost per unit across all your food plants from a single dashboard. For multi-site food manufacturers, this cross-plant comparison is often more valuable than external benchmarks because it controls for your specific product types, equipment fleet, and operational standards. Plants that consistently underperform relative to sister sites receive targeted attention and proven practices from the leading sites can be replicated.
Book a demo to explore multi-site KPI benchmarking.
KPI Dashboard · Real-Time Analytics · Audit-Ready Reporting · Free to Start
Your Food Plant Is Generating Data Every Shift. Turn It Into Decisions.
Oxmaint's CMMS dashboard populates OEE, MTTR, MTBF, PM compliance, maintenance cost, and audit readiness automatically — from work orders your team is already completing. No manual data entry. No spreadsheet gymnastics. No pre-audit panic. Just real-time visibility into the metrics that determine whether your plant operates at 60% OEE or 85%.