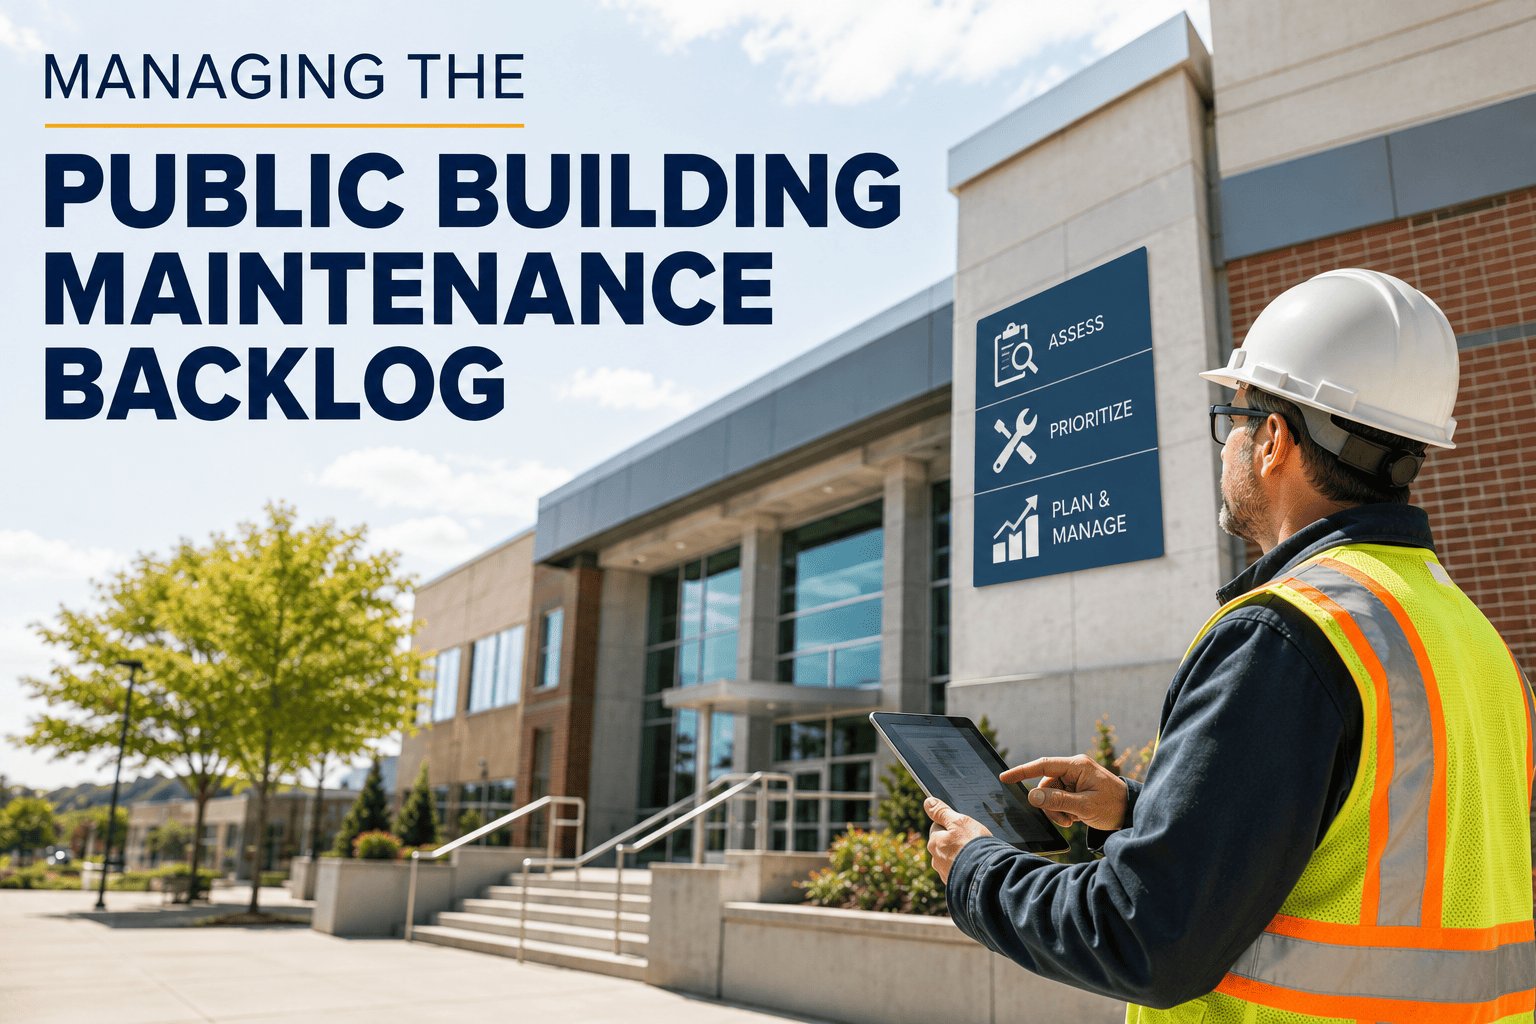
Every public building portfolio is quietly running the same experiment: postpone a repair long enough and find out how much more it costs later. Nationally, that experiment has produced a deferred maintenance bill of roughly $1 trillion across public infrastructure, with the federal building backlog alone more than doubling from $171 billion to $370 billion between 2017 and 2024. Facilities managers rarely lose the backlog through neglect — they lose it through fragmented asset data, reactive work orders, and budget requests that can't prove what they claim. The good news is that a backlog is a measurable, sequenceable problem once it's tracked in one place instead of scattered across spreadsheets and inspector memory. See how OxMaint helps agencies size and prioritize their backlog in a 30-minute walkthrough.
Your Maintenance Backlog Isn't a Budget Problem. It's a Visibility Problem.
Facilities managers can't fix what they can't see. OxMaint gives public building teams a single system to size the backlog, score risk by asset, and turn a wall of deferred work orders into a capital plan leadership will actually fund.
The Backlog Isn't Unique to Your Building
Every category of public facility is carrying the same compounding debt. Here's how it breaks down nationally.
How a $50,000 Repair Becomes a $250,000 Replacement
Deferred maintenance doesn't sit still. Every year it waits, the fix gets more expensive and the failure gets closer.
Turn Your Backlog Into a Ranked, Fundable Capital Plan
OxMaint logs every asset's age, condition, and criticality, then scores your entire portfolio so you know exactly which repairs protect safety and budget dollars first.
How to Score and Rank Backlog Items by Risk
A Facility Condition Index only helps if it's paired with a criticality score. This is the tiering model public agencies use to decide what gets funded first.
| Risk Tier | Condition Signal | Example Assets | Funding Priority |
|---|---|---|---|
| Critical | Safety code violation or active failure risk | Fire suppression, structural elements, electrical panels | Fund this cycle |
| High | Beyond expected service life, no redundancy | Aging HVAC, elevators, roofing membranes | Next budget cycle |
| Medium | Functional but showing measurable wear | Plumbing fixtures, parking structures, lighting | Plan within 2-3 years |
| Low | Cosmetic or minor operational impact | Interior finishes, signage, landscaping | Defer with monitoring |
What Backlog Reduction Looks Like With a CMMS in Place
One state agency managing 120 public facilities reversed eight straight years of backlog growth after centralizing asset data in OxMaint.
A backlog only feels unmanageable when it lives in someone's head or a folder of spreadsheets. Once every asset has an age, a condition score, and a criticality rating in one system, prioritization stops being a debate and becomes a calculation. That's the difference between a capital request that gets approved and one that gets deferred again.
Managing the Public Building Backlog — Common Questions
Stop Managing the Backlog From Memory
Get every asset, condition score, and repair history into one system your whole facilities team can act on — and start building the capital plan that finally gets funded.