America's public agencies are sitting on more than $1 trillion in deferred maintenance — roofs past their service life, HVAC systems running on borrowed time, and pipes waiting for the failure that turns a routine line item into an emergency capital request. Federal building repair backlogs alone more than doubled between 2017 and 2024, climbing past $370 billion, while states report close to $100 billion in unaddressed building repairs on top of that. Every dollar of maintenance deferred today compounds into four to six dollars of emergency repair cost tomorrow, which is exactly why the agencies making real progress are not simply working harder — they are working from a different playbook, one built on Facility Condition Index scoring, sequenced capital plans, and a maintenance system that catches failure before it happens, which is what oxmaint.ai was built to give public asset managers.
Government & Public Agencies · Deferred Maintenance Backlog Reduction
Every Dollar You Defer Today Comes Back As Six Tomorrow
A cracked roof membrane costs a few hundred dollars to patch this year. Left alone, it becomes a structural repair, a mold remediation project, and a capital replacement — all traceable to the same deferred work order. This is the compounding math every backlog reduction program has to interrupt, and it is the same math that turns a modest annual maintenance shortfall into a headline-grabbing capital crisis a decade later.
Year 0
1x cost
Scheduled repair, planned budget, minimal disruption to occupants or the public. The cheapest point at which any asset failure can possibly be addressed.
Year 2
2x–3x cost
Deferred item begins damaging adjacent systems, and the repair scope widens well beyond the original component that first showed wear.
Year 5
4x–5x cost
Component reaches functional failure, and reactive emergency response quietly replaces what should have been a scheduled maintenance line item.
Year 8+
6x+ cost
Full system replacement, safety exposure, and public-facing service disruption — the single most expensive outcome a deferred repair can reach.
$1T+
Estimated national deferred maintenance backlog across US public buildings and infrastructure combined
$370B
Federal building repair and maintenance backlog for FY2024 — more than double the FY2017 figure
$100B
Combined deferred maintenance reported by states for publicly owned buildings
$100B/yr
Approximate pace at which the national backlog continues to grow every year
Where Does Your Portfolio Sit on the FCI Scale?
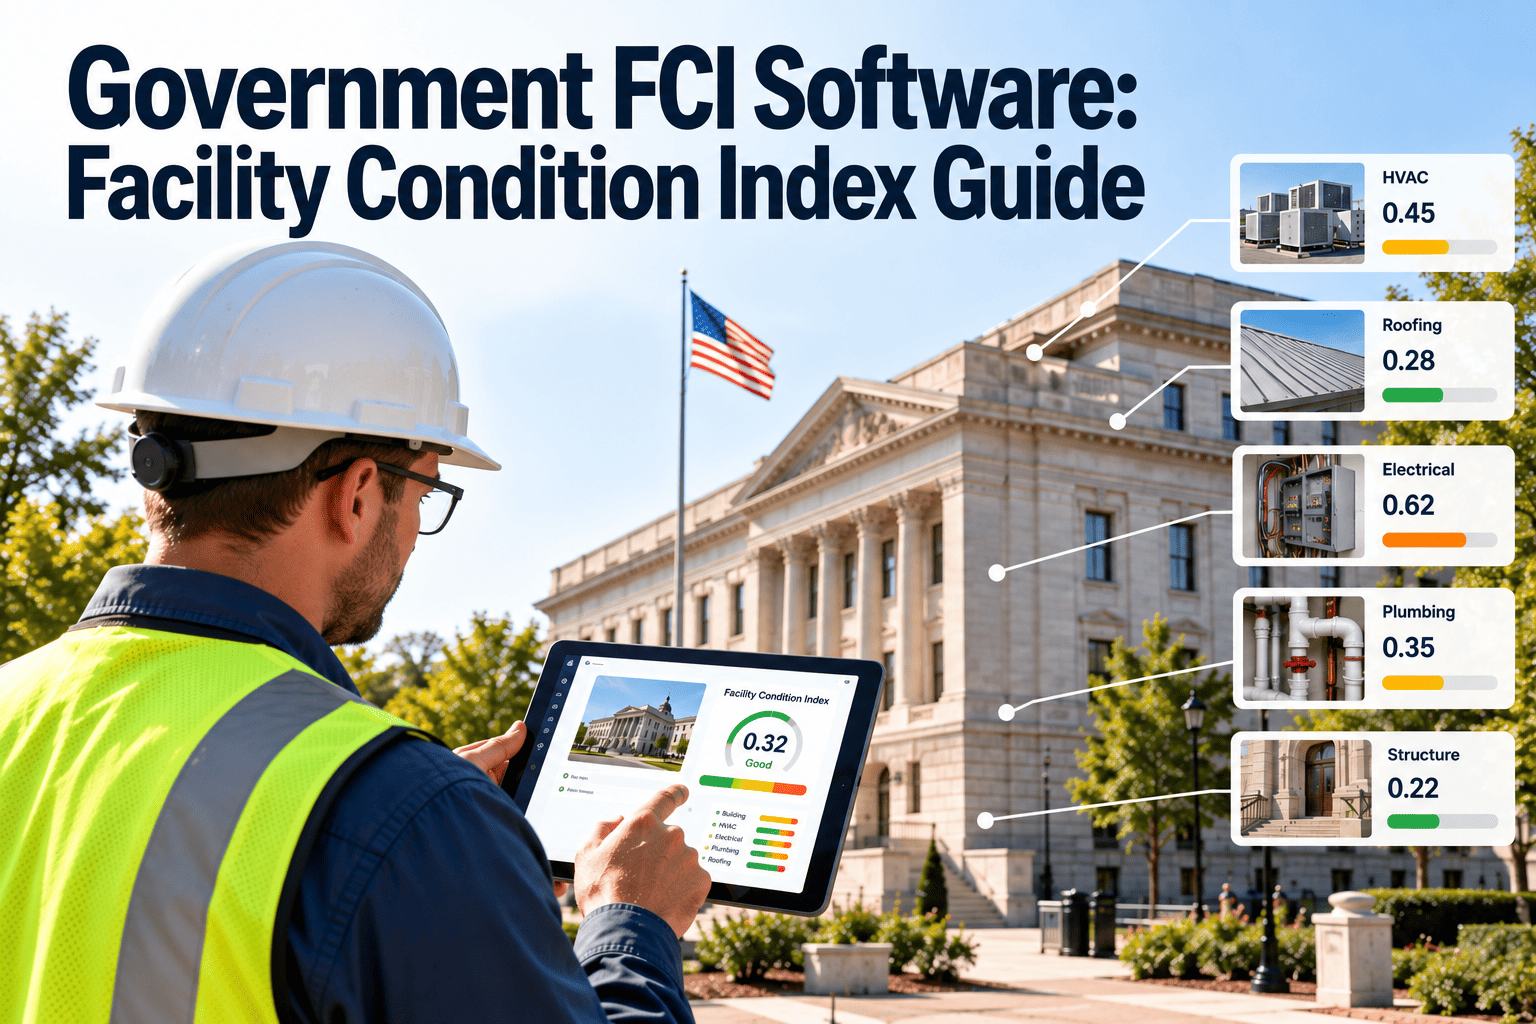
The Facility Condition Index divides the cost of needed repairs by a building's current replacement value, producing a single percentage that every stakeholder — council members, auditors, capital planning committees — can read the same way. It is the number that turns "our buildings feel old" into a defensible, trackable figure that justifies a budget request instead of inviting a debate about anecdotes.
Most public agencies discover, once they calculate FCI portfolio-wide for the first time, that their buildings are more spread across the scale than expected — a handful in Excellent condition sitting alongside several deep in Poor or Critical territory. That spread is exactly what a sequenced capital plan is meant to manage, one building and one system at a time.
Excellent
0–5%
Good
5–10%
Fair
10–30%
Poor
30–60%
Critical
60%+
Excellent / Good — under 10%
Backlog is within normal annual budget absorption. Focus stays on preventive maintenance and closely monitoring FCI drift before it moves into Fair territory.
Fair — 10% to 30%
A documented backlog exists that a structured multi-year capital plan can still resolve without resorting to emergency spending, provided sequencing starts now.
Poor to Critical — 30% and above
Deferred items now represent a meaningful share of replacement value. Reinvestment versus disposal becomes an explicit, budget-defining decision rather than a routine maintenance one.
A Six-Phase Framework for Shrinking the Backlog
Agencies that actually reduce their backlog — rather than watch it grow quietly in a spreadsheet — follow a repeatable sequence. Each phase produces the input the next phase needs, and skipping one is the most common reason capital requests get rejected at budget season. None of the six phases require new headcount; they require the existing team's work to be captured in a system instead of scattered across inspection binders, email threads, and institutional memory that walks out the door with every retirement.
01
Asset Registry & Condition Assessment
Build a complete digital inventory of every building system and component — make, model, install date, expected useful life, warranty status, and current condition score, all in one searchable registry.
02
FCI Scoring by Asset and Portfolio
Convert condition data into an FCI score for every building and roll it up to a portfolio-wide view that auditors and finance teams can compare consistently, year over year, building by building.
03
Risk-Weighted Prioritization
Rank backlog items by a combination of condition, mission criticality, and safety exposure — not simply by which complaint arrived most recently or which department shouted loudest.
04
Capital Sequencing
Map the prioritized list against multi-year funding cycles so every budget request is tied to a specific, defensible, and measurable reduction in portfolio FCI.
05
Reactive-to-Planned Conversion
Shift technician hours from emergency response toward scheduled preventive work, tracked as a ratio that moves visibly and steadily from quarter to quarter.
06
Continuous Monitoring & Reporting
Keep the FCI current as work orders close, so the next budget cycle starts from live, defensible data instead of a stale, multi-year-old assessment.
Where Backlog Reduction Programs Typically Stall
Most agencies do not fail at backlog reduction because leadership refuses to invest — they stall for quieter, more structural reasons that show up long before the first capital request is written. Recognizing these patterns early is often the difference between a program that compounds progress and one that resets to zero every time a key staff member changes roles.
A
Asset Data Lives in Silos
Condition notes sit in inspector binders, spreadsheets, and email threads that never reach a shared registry, so no one can see the full backlog at once.
B
No Consistent Scoring Method
Without a standardized FCI methodology, condition scores vary by inspector, making year-over-year portfolio comparisons unreliable and easy for auditors to challenge.
C
Emergencies Consume the Budget
Without a preventive maintenance program in place, every dollar earmarked for planned capital work gets reallocated to whichever asset just failed.
D
Capital Requests Lack Evidence
A budget ask without photos, condition scores, and a documented history is easy for a finance committee to defer another year in a tight cycle.
E
Progress Isn't Tracked Between Assessments
Agencies that only reassess FCI every few years lose the ability to show incremental progress, which weakens the case for sustained annual funding.
F
Institutional Knowledge Walks Out the Door
When the one technician who "just knows" an asset's history retires, the record of past repairs and root causes often retires along with them.
Reactive Firefighting vs. Planned Capital Renewal
The single biggest lever in backlog reduction is not more funding — it is converting hours spent reacting to failure into hours spent preventing it. The comparison below reflects the pattern seen across agencies that move from a paper-and-spreadsheet model to a structured CMMS-driven program, and it is usually the first table a finance committee asks to see once a backlog reduction program is proposed.
Metric
Reactive Model
Planned Model
Average repair cost per incident
High — emergency labor and rush parts
Low — scheduled labor and standard parts
Budget predictability
Volatile, driven by whichever asset fails next
Stable, tied to a multi-year capital plan
Asset lifespan impact
Shortened by run-to-failure cycles
Extended toward full expected useful life
Audit and FOIA readiness
Sparse records, hard to reconstruct history
Complete work order and condition history
FCI trend over time
Drifts upward year after year
Trends downward toward target range
Common Funding Pathways for Capital Renewal
A defensible FCI and a sequenced capital plan do more than satisfy an audit — they become the evidence base for whichever funding pathway an agency pursues. Most agencies end up combining more than one of the following, matched to the size, urgency, and useful life of the item being funded, rather than relying on a single funding source for the entire backlog.
Whichever pathway an agency chooses, the underlying requirement is the same: a lender, grant reviewer, or bond rating agency wants to see that the backlog is measured, sequenced, and tracked — not simply acknowledged as a known problem with no plan attached.
01
General Obligation or Revenue Bonds
Best suited for large, high-cost capital renewal projects where the asset's long useful life justifies financing the cost over a matching time horizon.
02
Dedicated Capital Reserve Funds
Annual set-asides tied directly to a portfolio's projected FCI drift, sized to keep the backlog from growing faster than the reserve can absorb.
03
State and Federal Grant Programs
Many infrastructure and resilience grant programs require documented condition data and a prioritized project list before an application is even considered eligible.
04
Energy and Performance Contracting
Guaranteed energy savings can fund HVAC, lighting, and envelope upgrades with no upfront capital outlay, directly reducing FCI on qualifying systems.
Your FCI Won't Improve Itself Between Budget Cycles
Oxmaint gives public asset managers the registry, the FCI scoring, and the capital sequencing tools to turn a growing backlog into a documented, funded reduction plan — before the next audit or budget hearing arrives.
What a Backlog Reduction Program Actually Returns
The return on a structured backlog program shows up in three places: avoided emergency spend, extended asset life, and faster budget approvals because the request is backed by data instead of anecdote. None of these returns depend on a large upfront capital infusion — they compound from the same maintenance budget an agency already has, redirected toward planned work instead of constant firefighting.
The scenario below reflects benchmarks reported across mid-size public agency portfolios moving from a reactive, paper-based model toward a structured, data-driven maintenance program.
Scenario: Mid-Size Public Agency · ~2,000,000 Sq Ft Portfolio · Starting FCI 22%
Emergency repair share of annual maintenance spend (reactive baseline)
45%–60%
Cost multiplier of deferred repair vs. scheduled repair (industry range)
4x–6x
Typical time to compile evidence for a capital budget request (paper baseline)
3–6 weeks
Federal building repair backlog growth, FY2017 to FY2024
$171B → $370B
Typical annual reserve funding gap versus industry-recommended replacement rate
1.5–3.5 pts of value
↓
Reduction in emergency repair share after 18–24 months of planned conversion
Typically 15–25 pts
Time to assemble a capital request with live FCI and work order data
Same-day export
Estimated avoided cost from catching one deferred item before failure escalates it 4x–6x
Pays for the platform many times over
The KPIs That Prove the Backlog Is Actually Shrinking
A backlog reduction program is only as credible as the metrics behind it. These six indicators are what capital planning committees and auditors ask for when they want proof the program is working, not just running, and they are the same numbers worth putting in front of a council before anyone else asks for them.
Target: ↓ each year
Portfolio FCI Trend
The single number that tells leadership whether the backlog is growing or shrinking, tracked quarter over quarter across the full asset portfolio and every building within it.
Target: ↓ each year
Backlog Dollar Value
Total estimated cost of all documented deferred items, updated in real time as new assessments arrive and older backlog items get resolved and closed out.
Target: < 30%
Reactive Spend Ratio
Share of the total maintenance budget spent on emergency response, measured against scheduled preventive and capital renewal work each fiscal quarter.
Target: > 80%
Capital Plan Coverage Ratio
Percentage of the documented backlog that currently has a funding line assigned somewhere within the agency's multi-year capital plan, not just on a wish list.
Target: > 95%
Asset Data Completeness
Percentage of assets in the registry carrying a current condition score, install date, and expected useful life — the foundation every other KPI on this list depends on.
Target: ↓ trend
Average Work Order Age
Median time an approved repair sits open before completion — often the clearest and earliest signal that the backlog has quietly started growing again.
These same six numbers double as the backbone of any audit or public records response an agency later faces. Auditors reviewing a deferred-maintenance program under modern government auditing standards are not looking for a narrative — they are looking for a trail of dated, consistent figures that show the backlog was measured, prioritized, and acted on rather than simply acknowledged in a footnote year after year.
Expert Perspective
I managed a state facilities portfolio for eleven years, and the year our FCI finally turned downward was not the year we got more funding — it was the year we could finally show, line by line, exactly what the backlog was made of. Before that, every budget request was a negotiation based on whichever building complained loudest, and the same three roofs got patched every winter while the real risk sat undocumented in a maintenance closet somewhere. Once we had a real asset registry and a scored condition assessment for every facility, the capital committee stopped arguing about whether the number was real and started arguing about sequencing, which is a much better conversation to have in a budget hearing. The technicians did not do more work. They did the same work in a smarter order, one that stopped the backlog from quietly compounding in the background. That is the entire program, in practice, and it is exactly why the agencies that treat this as a data problem consistently end up ahead of the ones that keep treating it only as a funding problem.
Renata Okafor-Whitfield, PE, CFM
Former State Facilities Director · 11 Years in Public Portfolio Management · Certified Facility Manager · Licensed Professional Engineer
Frequently Asked Questions
What is a realistic first-year FCI improvement for a poorly funded portfolio?
Portfolios starting in the Poor range typically see 1 to 3 percentage points of FCI improvement in year one, driven mostly by capturing accurate data and stopping avoidable escalation rather than by a large new capital spend. Momentum builds meaningfully after that.
Book a demo to see how a starting assessment gets built.
Do we need a full condition assessment before starting a CMMS rollout?
No. Most agencies begin logging work orders and building the asset registry in parallel with an ongoing condition assessment, so the backlog data becomes usable within weeks rather than waiting months for a full portfolio survey to finish before anything starts.
How does the platform help during an FOIA request or council budget hearing?
Every asset's condition history, photos, and FCI trend export as a single organized evidence pack, which replaces days of manually pulling records from spreadsheets and shared drives with a same-day, defensible response.
Can small agencies with limited IT staff run this without a dedicated administrator?
Yes.
Start a free trial to see the setup flow — most small agency portfolios are configured and running within days by a single facilities manager, without dedicated IT support or a formal rollout project.
Does converting to planned maintenance mean technicians lose flexibility for true emergencies?
No. Planned conversion reduces the volume of preventable emergencies, which actually frees technician capacity for the genuine emergencies that will always occur, rather than removing flexibility from the maintenance schedule.
None of the six phases, KPIs, or comparisons above require a portfolio to be perfect before starting. They require a starting point — one registry entry, one FCI score, one converted work order — and a system that keeps that progress visible instead of letting it fade back into a spreadsheet by next budget season.
The Backlog Grows Every Quarter You Don't Measure It
Oxmaint turns scattered condition data into a scored, sequenced, audit-ready backlog reduction plan — built for public asset managers who need to prove progress, not just report a number.