Most hospital maintenance teams collect plenty of numbers — work orders closed, hours logged, PMs done. Far fewer can say whether those numbers are good. A 78% PM compliance rate feels fine until you learn the top quartile sits above 95%, and the gap between them is exactly where unplanned failures, survey findings and budget overruns live. OXMAINT AI is the AI-powered maintenance management software that computes every KPI on this page live from your work-order data and shows you where each one stands against the benchmark.
Healthcare Maintenance KPIs · Benchmarks & Best Practices · 2027
Healthcare Maintenance KPIs: The Benchmarks That Separate Reactive From Best-in-Class
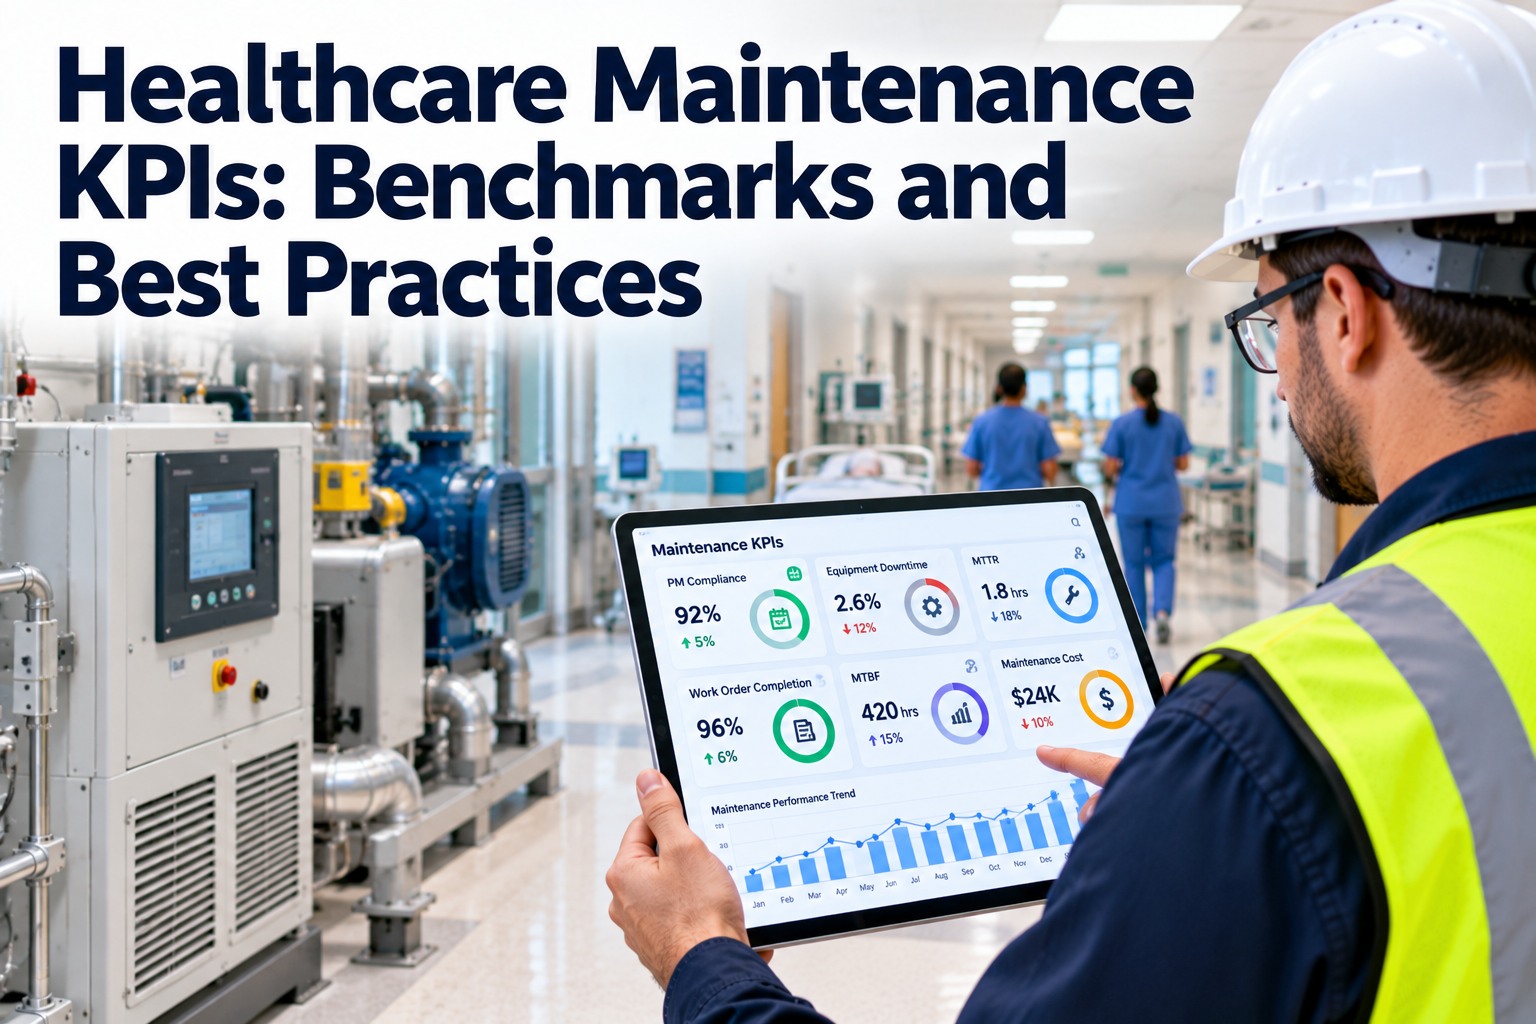
A KPI is only useful next to a benchmark. This is the scorecard hospital maintenance leaders use to grade their program — the five metrics that matter, what "good" actually looks like, and how the OXMAINT AI software turns each one from a monthly spreadsheet into a number that refreshes as your techs work.
PM Compliance
>95%
Best-in-class
Reactive Ratio
<20%
Best-in-class
Equipment Uptime
>98%
Best-in-class
MTTR (critical)
<2 hrs
Best-in-class
Leading vs Lagging: Know Which Kind You're Reading
Before the benchmarks, one distinction that changes how you use every number below. Lagging KPIs tell you what already happened — uptime, MTTR, downtime hours. Leading KPIs predict what's about to happen — PM compliance, backlog, schedule adherence. A program that only watches lagging metrics is always reacting; the ones that improve watch the leading metrics that move them. The OXMAINT AI software computes both, side by side. Book a demo to see your leading and lagging KPIs on one dashboard in OXMAINT AI.
LEADING — predicts what's coming
PM compliance rate · work order backlog · schedule adherence · planned-vs-reactive ratio
Move these and the lagging numbers follow. This is where a proactive program spends its attention.
LAGGING — reports what happened
equipment uptime · MTTR · MTBF · unplanned downtime hours · cost per work order
The outcomes leadership asks about — but you can't fix them directly, only the leading metrics that drive them.
The Five KPIs That Matter — and What "Good" Looks Like
These are the five metrics that show up on every serious hospital maintenance scorecard, each with the benchmark bands a reactive, average and best-in-class program typically land in. Read it as a self-assessment: find the column that describes you today, and the gap to the next one is your improvement plan. Start free and see where your own numbers fall against these bands in OXMAINT AI.
01PM Compliance RateLeading
Share of scheduled preventive maintenance completed on time. The single best predictor of whether your program is in control — below ~85% and reactive failures start to multiply.
Reactive58–65%
Average~78%
Best-in-class95%+
02Reactive-vs-Planned RatioLeading
The percentage of work that is unplanned, break-fix response. Every reactive work order costs far more than the same job planned — the lower this runs, the more of your budget is doing useful work.
Reactive42%+ reactive
Average~30% reactive
Best-in-classUnder 20%
03Critical Equipment UptimeLagging
The percentage of time life-critical equipment is available for patient care. For the highest-consequence assets, the bar is higher still — small gaps here translate directly into clinical disruption.
Reactive88–91%
Average~94%
Best-in-class98%+
04Mean Time To Repair (MTTR)Lagging
Average time to restore a failed asset, from report to fixed. Shorter MTTR means faster recovery when something does fail — driven by parts availability, clear assignment and good asset history.
Reactive12–18 hrs
Average~6 hrs
Best-in-classUnder 2 hrs
05Mean Time Between Failures (MTBF)Lagging
Average run time between failures of an asset. Rising MTBF is the clearest sign your preventive program is actually working — failures are getting rarer, not just faster to fix.
ReactiveFalling / untracked
AverageStable
Best-in-classRising per asset
Benchmark bands are drawn from widely cited healthcare maintenance reporting (ASHE / Joint Commission-aligned sources) and vary by facility size, asset mix and program maturity. Treat them as direction, not fixed targets — your own baseline and accreditation program set the real numbers.
The Root MetricFix One Number First: PM Compliance
If you only move one KPI this year, make it PM compliance. It's the leading metric that pulls the others along — raise it and reactive work falls, uptime climbs, MTBF rises and MTTR shortens, because fewer surprises means more planned, better-prepared work.
1PM compliance up → fewer unplanned failures
2Fewer failures → reactive ratio drops
3More planned work → uptime and MTBF rise
4Prepared work → MTTR shortens when failures do occur
A KPI You Compile Once a Month Is Already Out of Date.
The reason most hospital scorecards don't change behaviour is lag — by the time the monthly report lands, the reactive drift has already happened. The OXMAINT AI maintenance management software computes every KPI here live from work-order events, so a benchmark gap surfaces the moment it appears, not four weeks later.
How to Benchmark Without Fooling Yourself
A number is easy to game and easy to misread. These are the best practices that keep a maintenance scorecard honest — the difference between KPIs that drive real improvement and ones that just look good in a board deck. The OXMAINT AI software builds each metric from the raw work-order record, so the number traces back to what actually happened. Book a demo to see how each KPI traces back to its work orders in OXMAINT AI.
Define each KPI the same way every time
Is a PM "compliant" if done within ±10% of its interval? Agree the definition once — most benchmark disputes are really definition disputes.
Segment by asset criticality
A blended uptime number hides the one that matters. Track critical assets separately — a ventilator at 94% is a different story than a lobby fan at 94%.
Pair a leading KPI with its lagging one
Show PM compliance next to uptime, backlog next to MTTR. The pairing reveals cause and effect that a single number can't.
Watch the trend, not the snapshot
One month at 88% means little. The direction over six months is the real signal — improving, holding, or quietly drifting.
Build KPIs from the record, not re-entry
If a number is typed into a spreadsheet by hand, it's already suspect. Let the metric calculate itself from closed work orders.
Benchmark against yourself first
Industry bands orient you, but your own trend is the fairest comparison — beat last quarter before chasing someone else's number.
Why Hospital Scorecards Fail to Drive Change
Plenty of hospitals track KPIs and improve nothing. The failure is rarely the metric itself — it's how the data is gathered and acted on. These are the traps that turn a scorecard into a report nobody uses, all of which the OXMAINT AI software is built to avoid. Start free and build a scorecard that refreshes itself in OXMAINT AI.
Monthly lag
Data compiled weeks after the fact — the drift is already done by the time anyone sees it.
No benchmark
A number with nothing to compare it to tells you nothing — 78% feels fine until you know the target.
Blended averages
Rolling critical and non-critical assets into one figure hides the gaps that actually matter.
Vanity metrics
Counting work orders closed rewards volume, not reliability — busy is not the same as effective.
Hand-keyed data
Numbers re-entered by hand drift from reality and can't be trusted at review time.
No owner, no action
A gap surfaces and nothing happens — a KPI with no work order behind it never closes.
How OXMAINT AI Turns KPIs Into Action
A scorecard is only worth the behaviour it changes. The OXMAINT AI maintenance management software computes each KPI live, flags the ones off benchmark, and ties every gap back to the work that closes it — so the number doesn't just get reported, it gets moved. Book a demo to see your live KPI scorecard in OXMAINT AI.
LIVE KPIs
PM compliance, reactive ratio, uptime, MTTR and MTBF computed live from work-order events — no monthly spreadsheet compile.
BENCHMARK VIEW
Each metric shown against its target band, so a gap is visible at a glance the moment it opens.
BY CRITICALITY
KPIs segmented by asset class and criticality, so the critical-equipment number never hides inside a blended average.
TREND & HISTORY
Direction over time per asset and department — the six-month trend that tells you if you're improving or drifting.
PM ENGINE
Automated preventive scheduling and escalation to lift the root metric — PM compliance — that moves all the others.
GAP → WORK ORDER
Every off-benchmark gap ties back to the work orders that close it, so the scorecard drives action, not just reporting.
Expert Review
The KPIs and benchmark bands on this page are a general framework, not fixed targets for any one hospital. Figures such as PM compliance, reactive ratio, uptime, MTTR and MTBF ranges are drawn from widely cited healthcare maintenance and facility reporting (ASHE and Joint Commission-aligned sources) and vary by facility size, asset mix, case load and program maturity — they orient a self-assessment rather than define a pass mark. How each KPI is defined (for example, the tolerance window that makes a PM "compliant") materially changes the number, so definitions should be agreed and held constant before any benchmark comparison. Clinical-equipment maintenance intervals and the KPIs tied to them ultimately follow manufacturer requirements and your accreditation program. OXMAINT AI is the maintenance management software that computes these metrics from your work-order data and surfaces them against benchmarks — it supports the measurement and improvement program your facilities and biomedical teams own; it does not set clinical or regulatory targets.
Frequently Asked Questions
What are the most important healthcare maintenance KPIs to track?
The core set is PM compliance rate, reactive-vs-planned work ratio, critical equipment uptime, mean time to repair (MTTR) and mean time between failures (MTBF). Together they cover whether work is planned or reactive, whether assets are available, and how quickly and how often they fail. The OXMAINT AI maintenance management software computes all five live from your work-order data.
Start free and see all five on one scorecard in OXMAINT AI.
What's a good PM compliance rate for a hospital?
Industry reporting generally puts best-in-class programs above 95%, with roughly 85% as the line below which reactive failures start to multiply; many facilities sit in the high-70s. For high-risk medical equipment, accreditation expectations push toward 100% documented PM. Treat these as orientation — your accreditation program and asset mix set the real target.
Book a demo to see your PM compliance against the benchmark bands.
What's the difference between leading and lagging maintenance KPIs?
Leading KPIs predict what's coming and can be acted on directly — PM compliance, backlog, schedule adherence. Lagging KPIs report outcomes that already happened — uptime, MTTR, downtime hours. You improve a lagging metric by moving the leading metrics that drive it, which is why a good scorecard shows both together.
Book a demo to see leading and lagging KPIs paired on one dashboard.
How often should maintenance KPIs be reviewed?
Leadership typically reviews monthly, but the metrics themselves should refresh continuously. A once-a-month compile means a benchmark gap has already been open for weeks before anyone acts. When KPIs calculate live from work-order events, a drift surfaces the day it starts — the review becomes a decision, not a discovery.
Book a demo to see KPIs that refresh as your techs work.
Which single KPI should we improve first?
Stop Reporting KPIs. Start Moving Them.
Put every healthcare maintenance KPI on one live scorecard with the OXMAINT AI maintenance management software — PM compliance, reactive ratio, uptime, MTTR and MTBF, each shown against its benchmark, segmented by criticality, and tied back to the work orders that close the gap. Grade your program today and watch the numbers move.