Every hotel ownership group eventually faces the same question: what is the provable return on a CMMS investment, and how do you build a case that survives scrutiny from an asset manager or ownership committee? The challenge is that most CMMS ROI claims are built from manufacturing benchmarks that do not translate to the hospitality operating model. Hotel maintenance ROI is driven by a different set of mechanisms — reactive repair cost elimination, guest satisfaction score recovery, asset life extension, and labor productivity gains across a 24-hour operating environment — and requires hospitality-specific data to be credible [citation:4]. Properties that have completed a purpose-built hospitality CMMS deployment are achieving 200–400% ROI within 18 months, with a median payback period of 4.2 months from go-live [citation:4]. Start a free trial to begin capturing ROI data from day one, or book a demo to model the ROI calculation against your property's specific maintenance spend data.
How to Justify Hotel CMMS Investment to Ownership
Make the business case for CMMS — learn how to calculate ROI, quantify benefits across five value drivers, and present a compelling case to hotel owners and asset managers.
The Business Case Builds Itself — Once You Have the Data
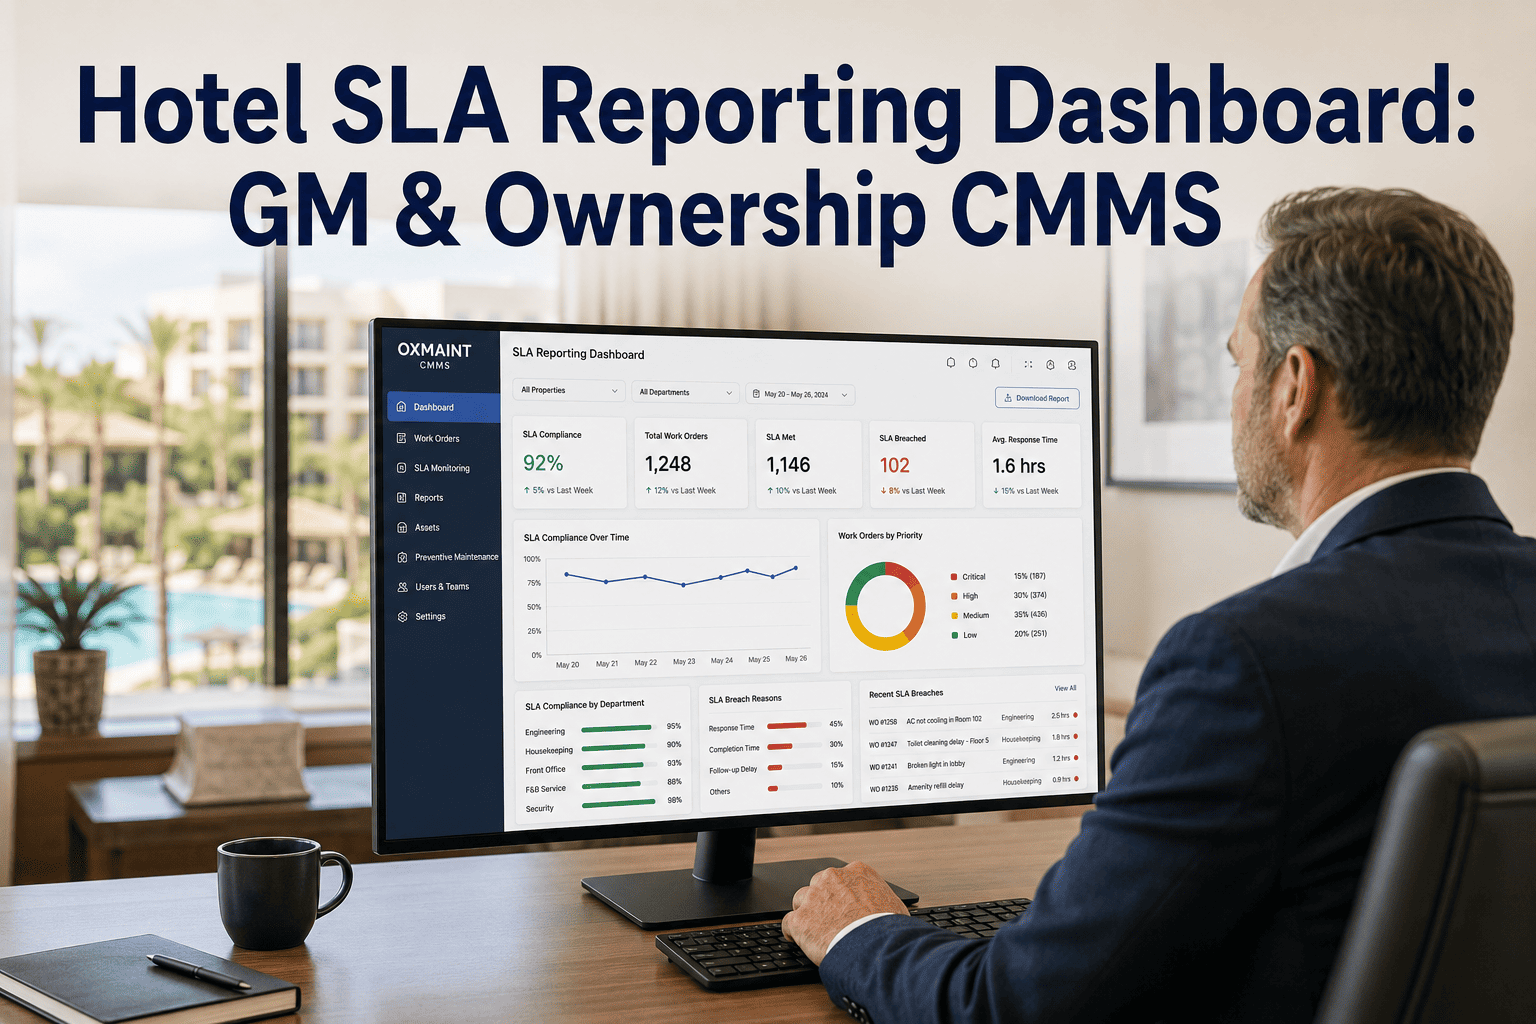
Most CMMS ROI claims lack the hospitality-specific data that ownership committees require. Hotel CMMS ROI is driven by five distinct value drivers — emergency repair elimination, labor productivity, guest satisfaction recovery, asset lifespan extension, and parts procurement optimization [citation:4]. Oxmaint's analytics dashboard produces property-specific ROI figures automatically from live maintenance data. Hotel operations leaders building a business case can start a free trial or book a demo to have Oxmaint's team build this analysis from your property's maintenance history before you present to ownership.
Why Generic CMMS ROI Calculations Fail Hotel Ownership Presentations
Most CMMS ROI claims are built from manufacturing benchmarks that do not translate to the hospitality operating model. Generic platforms evaluate ROI through metrics that have little meaning to hotel asset managers — machine uptime, production throughput, and factory floor efficiency. Hotel maintenance ROI is driven by guest satisfaction, room revenue protection, and capital expenditure deferral — metrics that require hospitality-specific measurement [citation:4].
The hospitality gap is structural. Hotels operate 24/7 with guest-occupied assets that cannot be taken offline for maintenance without revenue impact. A hotel HVAC failure does not just cost repair labor — it costs room revenue, negative reviews, and future booking losses. Generic CMMS platforms treat a hotel guest room the same as a factory floor station — they have no concept of room status tied to housekeeping, no understanding that the same chiller serves 120 rooms with different occupancy profiles, and no mechanism for linking maintenance history to guest complaint records [citation:3].
The Five ROI Drivers — Where the Return Actually Comes From
Hotel CMMS ROI is not produced by a single mechanism — it is the compounding result of five distinct value drivers, each producing measurable savings independently but creating outsized returns when they operate together [citation:4]. Properties measuring all five drivers produce the 200–400% ROI figures that survive ownership scrutiny.
ROI Drivers 4 & 5 — Asset Extension and Procurement Optimization
Asset lifespan extension and procurement optimization are often overlooked in CMMS ROI calculations, yet they represent 17–23% of total ROI in hospitality deployments [citation:4]. These drivers demonstrate the strategic value of CMMS beyond operational efficiency.
A hotel HVAC chiller unit has a design lifecycle of 15–20 years. Properties running reactive maintenance see early failures at 9–12 years — a 25–40% lifespan shortfall. CMMS-deployed properties show 22% asset lifespan extension versus expected lifecycle [citation:4]. For a property with $2.4M in depreciating mechanical assets, this produces $44,000–62,000 in deferred replacement per year. The calculation for ownership is simple: replacement cost of major assets ÷ expected lifecycle years × 22% extension = annual CapEx deferral value.
Emergency procurement carries a 40–180% premium over planned procurement through preferred supplier agreements. When CMMS generates work orders from predictive alerts 14–42 days before predicted failure, parts orders are placed at standard lead time under contracted rates [citation:4]. For a property spending $68,000 per year on emergency parts at reactive rates, a 67% reduction in reactive events converts approximately $24,000 of spend from spot to contracted pricing — producing direct saving of $9,600–14,400 before other ROI drivers are counted.
ROI Benchmarks by Property Segment — Setting Realistic Expectations
ROI varies by property segment, primarily driven by three factors: baseline reactive maintenance spend (higher reactive spend = higher absolute saving), ADR (which amplifies the guest satisfaction ROI driver), and maintenance team size (which determines the labor productivity driver value) [citation:4]. The table below presents conservative, average, and outperforming ROI outcomes based on deployed data.
| Property Segment | Annual Subscription | Conservative ROI | Average ROI | Median Payback |
|---|---|---|---|---|
| Budget / Economy (under 100 keys) | $3,600–5,400 | 110% | 190% | 6.2 months |
| Midscale (100–250 keys) | $7,200–10,800 | 160% | 260% | 4.2 months |
| Upscale (250–400 keys) | $12,000–18,000 | 180% | 310% | 3.8 months |
| Luxury and Full-Service (400+ keys) | $18,000–28,000 | 200% | 360% | 3.1 months |
| Resort and Extended Stay | $10,800–16,800 | 190% | 340% | 3.4 months |
| Multi-Property Portfolio (5+ hotels) | $28,000–48,000 | 220% | 390% | 2.8 months |
Building the Business Case — What Ownership Committees Actually Want to See
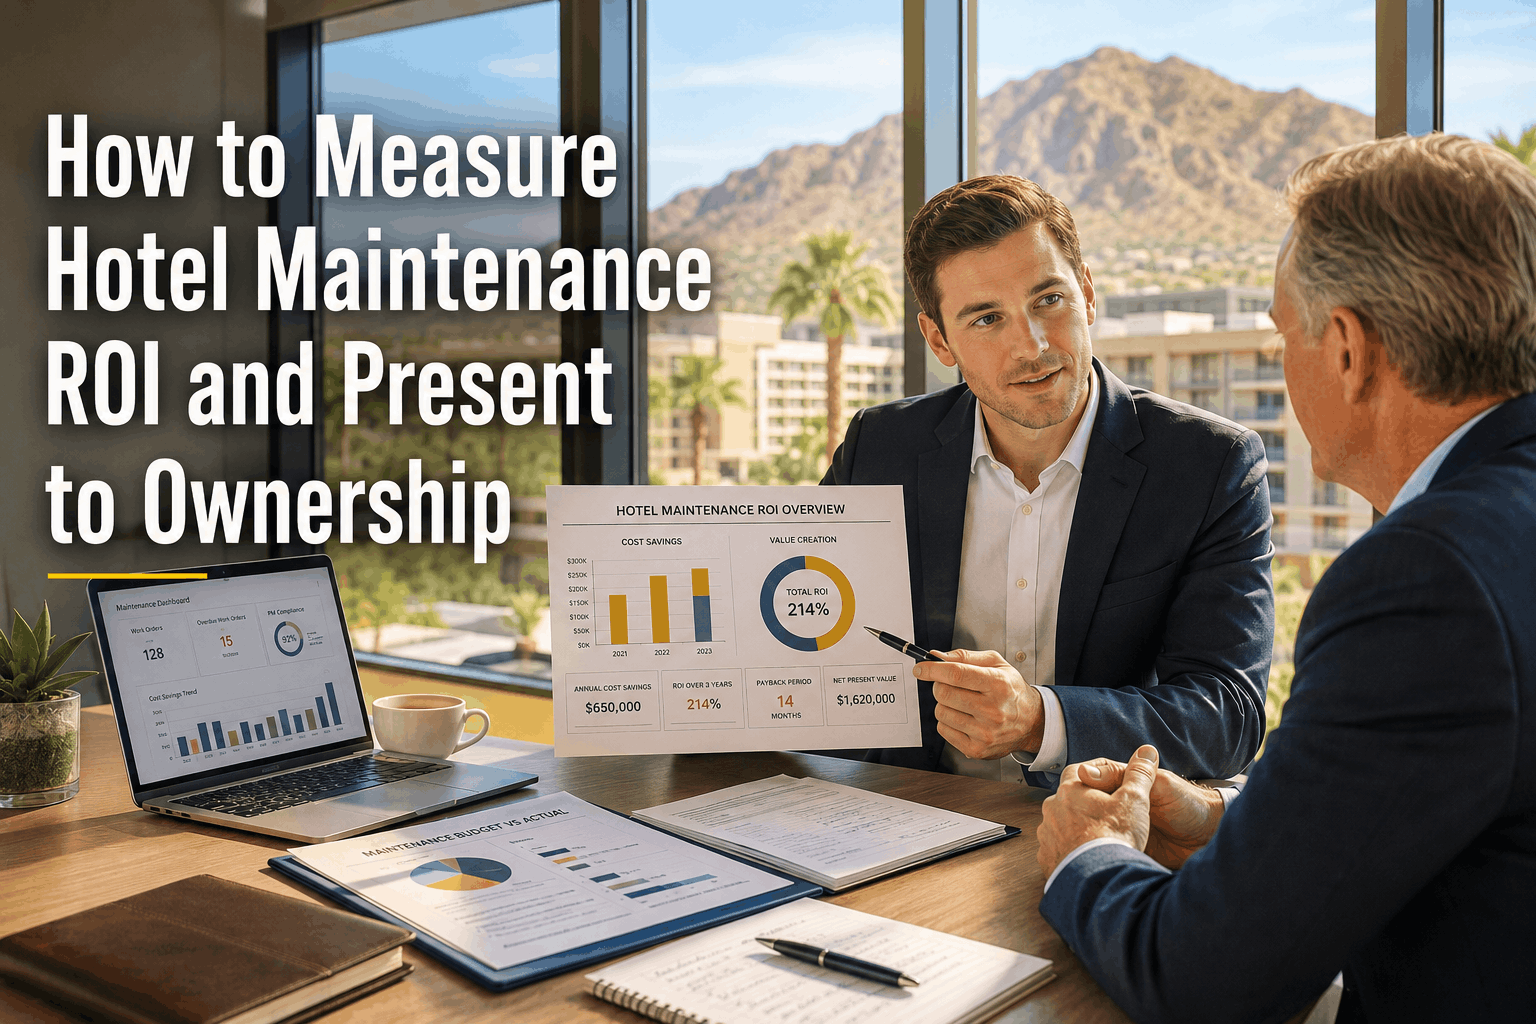
Asset managers and ownership committees reviewing a CMMS investment proposal evaluate four questions in sequence. Answering all four with property-specific data — rather than industry benchmarks — is the difference between a proposal that passes and one that is deferred [citation:4].
Present the true maintenance cost — not just the maintenance invoice. Pull the last 12 months of contractor invoices, parts purchases, guest compensation logs, and overtime labor reports. Most properties significantly understate their true maintenance spend because they measure only the contractor invoice, not the hidden costs of guest compensation, review impact, and cascading secondary repairs [citation:4].
Present the five ROI drivers with property-specific projections. Use the benchmark tables above but supplement with your property's specific numbers. The most credible ROI calculations use the property's own maintenance records — emergency repair logs, labor hours, guest complaint records, and asset replacement history. The 6.2x first-year ROI is achievable when all five drivers are measured [citation:2].
The fastest-appearing returns — emergency repair reduction and technician productivity — are visible within 30-60 days of deployment [citation:2]. For a 280-room full-service hotel, conservative annual value across all five drivers is approximately $140,000 against a platform cost of approximately $7,800 per year — a 6.2x ROI [citation:2]. The median payback period is 4.2 months [citation:4].
67% of hotel CMMS implementations fail to reach full adoption within 18 months due to poor platform fit with hospitality workflows [citation:3]. Investments in training, workflow design, and adoption support drive sustained utilization. Properties investing 25-35% of implementation resources in training and adoption achieve 80-90% sustained system utilization versus 40-50% for technology-only deployments [citation:1].
Key Performance Metrics to Track Post-Implementation
Successful CMMS adoption is measured by operational outcomes, not platform usage statistics. Track these metrics monthly from day 30 onward to quantify ROI and identify where the platform is driving the greatest value for your property [citation:3].
Summary ROI — The Business Case in Numbers
For a 280-room full-service hotel, $140,000 in annual value against $7,800 platform cost [citation:2]
Subscription cost recovery from go-live; fastest returns visible within 30-60 days [citation:4]
Average annual savings per room vs. reactive maintenance baseline [citation:4]
Purpose-built hospitality CMMS deploys in weeks, not months [citation:4]
Frequently Asked Questions
What is the average ROI of a CMMS for a hotel?+
How long does it take for a hotel CMMS to pay for itself?+
What are the five ROI drivers for hotel CMMS investment?+
What data do I need to build a credible hotel CMMS business case?+
The Business Case Builds Itself — Once You Have the Data
Oxmaint's analytics dashboard produces the property-specific ROI figures ownership committees require — automatically, from your live maintenance data. 200–400% ROI. 4.2-month payback. The case builds itself. Start your free trial today or book a demo to have our team model the ROI calculation against your property's specific maintenance spend data.