How to Measure Hotel Maintenance ROI and Present to Ownership
By Alex Jordan on June 3, 2026
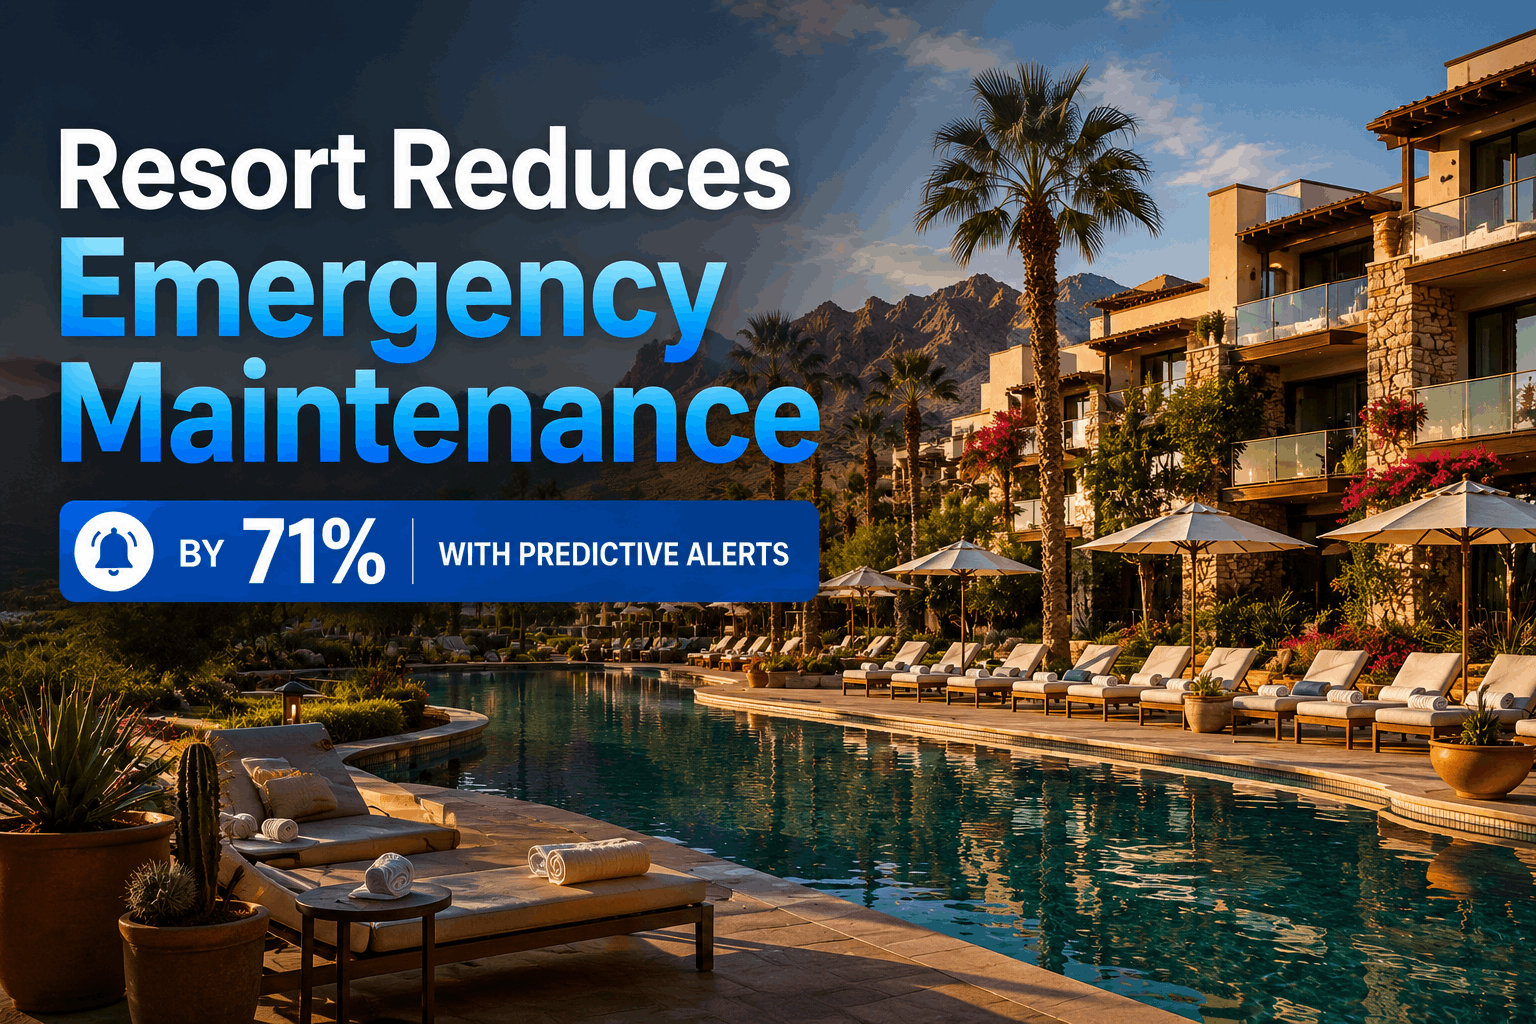
Hotel maintenance budgets face scrutiny from ownership — and without data-driven proof of value, your maintenance team is constantly defending operating costs. The challenge is clear: traditional reactive maintenance appears cheaper until catastrophic failures occur at 2 AM, costs balloon to 3–5 times normal rates, and guest satisfaction scores plummet from a single HVAC failure. Ownership wants proof that preventive maintenance delivers measurable ROI. Data shows this clearly — hotels implementing structured maintenance tracking reduce emergency repairs by 70%, cut total maintenance costs by 25–35% within the first 12 months, and extend equipment life by 20–30%, deferring capital replacement by 3–5 years. The real financial case isn't theoretical. It's measurable, it's auditable, and it converts skeptical ownership into maintenance advocates.
HOTEL MAINTENANCE MANAGEMENT · OXMAINT PLATFORM
Transform Maintenance Spend Into Measurable Asset Value
Track every repair, every prevented emergency, every dollar saved. Oxmaint's hotel maintenance management platform quantifies ROI — showing ownership exactly where the money goes and where the savings compound.
The Five Financial Levers of Hotel Maintenance ROI
Every hotel owner and asset manager understands profit margins. What they may not understand is that maintenance decisions directly control five measurable profit levers — each one quantifiable, each one defensible, and each one compounding over time. These aren't estimates. They're real figures from US hotel properties with 100–300 rooms operating structured preventive maintenance programs and digital CMMS platforms that track costs and outcomes in real time.
5 Financial Levers Driving Hotel Maintenance ROI
Published data from 100+ US hotel deployments, 2024–2025
Emergency Repair Avoidance
$1,200–$3,500 per prevented failure
Scheduled HVAC maintenance costs $400–$800. Emergency repair at 2 AM during peak occupancy costs $1,500–$3,000, plus guest refunds, lost revenue, and review damage. That single HVAC compressor failure prevented saves $3,500–$5,200 in total impact.
Unplanned Room Downtime Recovery
$90,000–$200,000 annually per property
Preventive maintenance keeps 95%+ of rooms in service year-round. Properties without it average 4–8 out-of-service days per room annually. At $280–$350 ADR, that's $280,000–$420,000 in lost annual revenue for a 200-room hotel.
Equipment Life Extension
$2.0M–$4.5M deferred capital spend
Well-maintained equipment lasts 20–30% longer. A $40,000 HVAC compressor replaced at 10 years vs. 7 years defers $40,000 in capital expenditure. Across all building systems, this compounds to $2M+ saved over a 5-year horizon for a mid-size hotel.
Energy Consumption Reduction
$18,000–$45,000 annually per property
Unmaintained HVAC systems run 20–30% harder than baseline, wasting energy continuously. Properly calibrated systems, clean filters, and timely compressor servicing reduce energy costs by 15–25% annually — $150–$375 per room per year.
Guest Satisfaction & Reputation Protection
10–15% occupancy impact per review score drop
A single HVAC failure generating 147 complaints can drop review scores from 4.2 to 3.7 stars. Each 0.5-star drop costs 10–15% occupancy across OTAs. For a 200-room hotel at 75% occupancy, that's $180,000–$280,000 annual revenue loss.
Real Cost Comparison: Preventive Vs. Reactive Maintenance
Numbers tell the story more clearly than arguments. Below is a published cost comparison from 200-room US hotel properties operating over a 12-month period. One column represents reactive maintenance — the historical approach. The other represents structured preventive maintenance powered by CMMS software and systematic schedules. The gap is not theoretical. This is documented hotel operator data.
Annual Maintenance Cost: Preventive vs. Reactive
200-room US hotel property, actual operator data 2024–2025
How to Calculate & Present Maintenance ROI to Hotel Ownership
Ownership responds to data. Here are the specific calculations, supported by real-world examples, that convert maintenance managers into valued business partners — not just cost centers. These metrics are auditable, they're defensible in investor presentations, and they're based on actual hotel operations across the USA.
Emergency Repair Frequency Metric
CALCULATION
Count unplanned repairs per quarter. Year 1 baseline: 12–18 emergency calls. Year 2 with preventive maintenance: 3–4 emergency calls. Multiply avoided calls × average emergency cost ($1,200–$3,500) = annual avoidance value. For one property: 10 avoided emergencies × $2,500 average = $25,000 annual protection.
Room Availability Tracking
DATA SOURCE
Extract from PMS: rooms out of service due to maintenance. Baseline without PM: 4–8 days per room annually. With PM: 0.5–1 day annually. Multiply rooms × days saved × ADR = revenue recovery. Example: 200 rooms × 5 days × $300 ADR = $300,000 annual room availability protection.
Guest Satisfaction Score Impact
AUDIT MEASURE
Track OTA review scores monthly. Document any score drops caused by maintenance failures. Industry standard: each 0.5-star drop = 10–15% occupancy loss. Example: 4.2 to 3.7 stars = 15% occupancy decline on 200 rooms = 30 fewer rooms sold = $9,000/day revenue loss × 365 = $3.2M annual impact averted.
Energy Cost Baseline & Optimization
MONTHLY AUDIT
Baseline energy spend before PM implementation. Monthly breakdown by utility (HVAC, lighting, water, other). After structured maintenance: expect 15–25% reduction in HVAC alone. Example: $60,000 monthly utilities × 20% savings = $12,000/month = $144,000 annual energy cost reduction.
Equipment Lifespan Tracking
DEPRECIATION IMPACT
Document original equipment cost and expected lifespan. Track actual replacements vs. planned. Extend HVAC from 7 to 10 years = $40,000 deferral. Extend boiler from 12 to 15 years = $35,000 deferral. Sum all deferred capex across 50+ building assets = $2M+ capital preservation over 5 years.
PM Compliance & Reactive Ratio
OPERATIONAL KPI
Measure percentage of work orders that are planned (PM) vs. unplanned (reactive). Industry target: 80% planned, 20% reactive. Track this monthly. Improvement from 50% to 80% planned work = proof that your team is shifting from firefighting to strategy. This metric demonstrates operational maturity to ownership.
"We implemented preventive maintenance tracking and were able to show ownership $420,000 in annual savings within the first 12 months. That proof transformed the conversation from 'Why does maintenance cost so much?' to 'How do we invest more in maintenance to protect the asset?'"
— Hotel Engineering Director, 240-room Select Service Property, USA · 2025
Building the Business Case: Ownership Presentation Framework
Here's exactly how to structure a presentation to ownership using these financial levers. This framework has worked in boardrooms from Austin to Boston, converting skeptical ownership into maintenance advocates — because the math is undeniable.
SLIDE 1
The Problem: Reactive Cost Spiral
Show ownership the current state — emergency repair frequency, room downtime costs, guest satisfaction impact. Use last year's data. Show the 12–18 emergency calls, the days out of service, the OTA score trends. Make the problem real, not abstract.
FRAME
SLIDE 2
The Solution: Structured Preventive Maintenance
Explain the CMMS platform, digital checklists, and systematic PM schedules. Show how this shifts workload from reactive (firefighting) to planned maintenance. Present the 80/20 planned-vs-reactive ratio target. Emphasize: this is about control, not cost.
EDUCATE
SLIDE 3
Financial Impact: 5 Quantifiable Levers
Walk through each of the five ROI levers with property-specific numbers. Use conservative estimates — ownership will respect that. Emergency repair avoidance: your data. Room downtime recovery: PMS extraction. Energy savings: utility bills. Equipment life extension: capex schedule review.
PROVE
SLIDE 4
Implementation Timeline & Cost
Be transparent: CMMS platform cost (typically $1,000–$3,000 setup + $25–$75/user/month), integration time (2–4 weeks), staff training (minimal). Show these costs against the first-month savings — ROI is often realized within 60 days. Ownership values transparency.
INVEST
SLIDE 5
Expected Outcomes & 12-Month Dashboard
Show the dashboard framework you'll track: emergency repair frequency, room downtime hours, guest satisfaction scores, energy costs, and PM compliance ratio. Commit to monthly reporting. Schedule quarterly ownership reviews. Accountability builds trust — and trust converts budget defenders into partners.
MONITOR
Frequently Asked Questions — Presenting Maintenance ROI to Hotel Ownership
How quickly can we prove ROI to ownership?
Most hotels see measurable savings within 60–90 days of implementing preventive maintenance. Emergency repair frequency drops immediately, room downtime decreases, and energy optimization kicks in. Conservative ownership will see this within the first quarterly review.
What if our property is too small to justify a CMMS system?
CMMS systems scale down. Even 50-room properties benefit from digital checklists and work order tracking. Monthly cost is under $300 for small properties — easily justified by preventing a single emergency repair. The ROI math still holds.
How do we handle ownership skepticism about "soft" savings like guest satisfaction?
Convert soft savings to hard numbers. Each 0.5-star OTA score drop = 10–15% occupancy loss = specific dollar amount of revenue. Link maintenance failures directly to review trends using your actual property data. Make the connection undeniable.
Should we present preventive maintenance as cost reduction or revenue protection?
Both. Frame it as risk mitigation and revenue protection first — avoiding downtime and review score drops protects revenue. Then show cost reduction through energy savings and deferred capex. Protection resonates louder with ownership than cutting corners.
What KPIs should we track to prove ongoing value?
Track six core metrics: emergency repair frequency (trending down), room availability percentage (trending up), guest satisfaction score, energy cost per available room, planned-vs-reactive work ratio (targeting 80/20), and equipment downtime hours. Report monthly.
Can we use Oxmaint to generate the reports ownership needs?
Yes. Oxmaint generates automated monthly reports showing all six KPIs, cost avoidance calculations, and trend analysis. Export data for ownership presentations with zero manual consolidation. The platform builds the case for you, month after month.
How do we handle multi-property ownership that compares our property to others?
Benchmark your metrics against industry standards. A 200-room hotel should achieve $8–$15 maintenance cost per available room. 80% PM compliance. Under 2% emergency repair frequency. Use published benchmarks from STR, CoStar, or AHLA to position your improvements within industry norms.
OXMAINT HOTEL MAINTENANCE PLATFORM · PROVEN ROI
Convert Your Maintenance Spend Into Measurable Asset Value