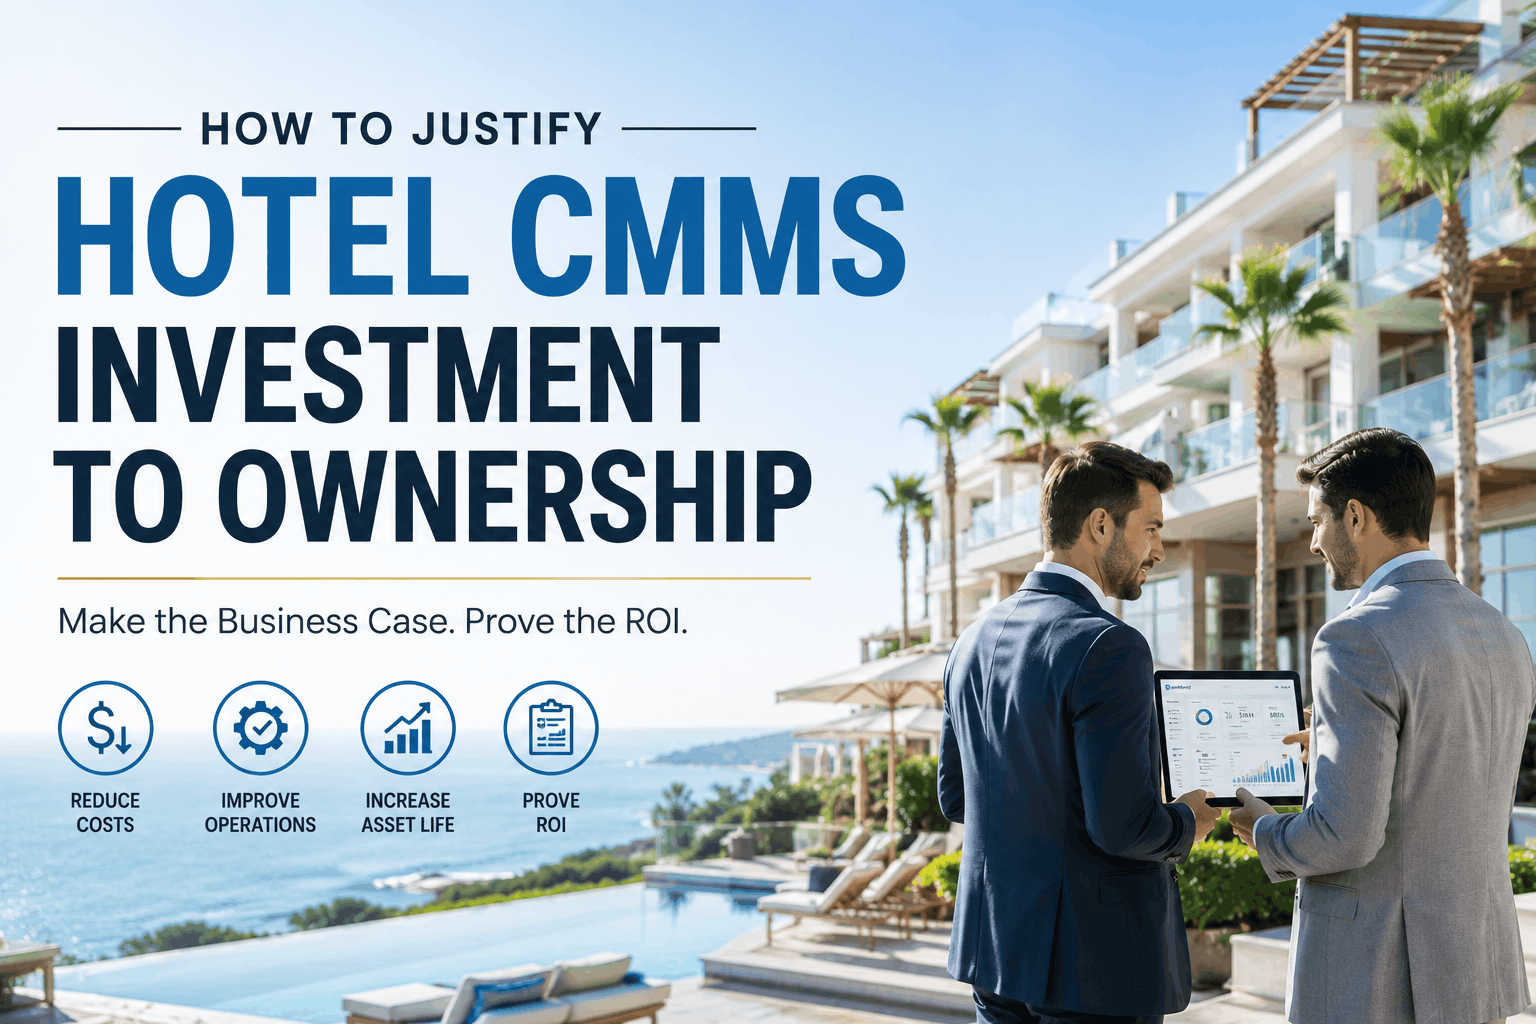
Every hotel ownership group eventually faces the same question: what is the provable return on a CMMS investment, and how do we build a case that survives scrutiny from an asset manager or ownership committee? The challenge is that most CMMS ROI claims are built from manufacturing benchmarks that do not translate to the hospitality operating model. Hotel maintenance ROI is driven by a different set of mechanisms — reactive repair cost elimination, guest satisfaction score recovery, asset life extension, and labour productivity gains across a 24-hour operating environment — and requires hospitality-specific data to be credible. This article presents that data. Properties that have completed an OxMaint deployment are achieving 200–400% ROI within 18 months. The median payback period, measured from go-live to full subscription cost recovery, is 4.2 months. Sign up for OxMaint to begin your deployment, or book a demo to model the ROI calculation against your property's specific maintenance spend data.
The 5 ROI Drivers: Where the Return Actually Comes From
Hotel CMMS ROI is not produced by a single mechanism — it is the compounding result of five distinct value drivers, each of which produces measurable savings independently but creates outsized returns when they operate together. Properties that measure all five drivers produce the 200–400% ROI figures in the headline. Properties that measure only the most visible driver — emergency repair cost reduction — consistently understate the return. Sign up for OxMaint to begin capturing data across all five drivers from day one of your deployment.
ROI Driver Deep Dive: Quantifying Each Value Category
Each of the five ROI drivers has a distinct measurement methodology and a specific OxMaint module that produces the data required to verify the return. The sections below provide the calculation approach for each driver with the data inputs required. Properties building a business case for ownership committees should use these frameworks to construct their property-specific projections from actual maintenance event records. Book a demo to have OxMaint's team build this analysis from your property's maintenance history before you present to ownership.
ROI Benchmarks by Property Segment: Setting Realistic Expectations
ROI varies by property segment, primarily driven by three factors: the baseline reactive maintenance spend (higher reactive spend = higher absolute saving), ADR (which amplifies the guest satisfaction ROI driver), and maintenance team size (which determines the labour productivity driver value). The table below presents conservative, average, and outperforming ROI outcomes for each property segment based on deployed OxMaint data.
| Property Segment | Annual Subscription | Conservative ROI (12 mo) | Average ROI (18 mo) | Outperforming ROI (18 mo) | Median Payback Period |
|---|---|---|---|---|---|
| Budget / Economy (under 100 keys) | $3,600–$5,400 | +110% | +190% | +280% | 6.2 months |
| Midscale (100–250 keys) | $7,200–$10,800 | +160% | +260% | +380% | 4.2 months |
| Upscale (250–400 keys) | $12,000–$18,000 | +180% | +310% | +440% | 3.8 months |
| Luxury and Full-Service (400+ keys) | $18,000–$28,000 | +200% | +360% | +520% | 3.1 months |
| Resort and Extended Stay | $10,800–$16,800 | +190% | +340% | +480% | 3.4 months |
| Multi-Property Portfolio (5+ hotels) | $28,000–$48,000 | +220% | +390% | +580% | 2.8 months |
Swipe horizontally on mobile. ROI calculated across all five value drivers. Conservative scenario captures DRV-01 and DRV-02 only. Average and outperforming scenarios include all five drivers. Figures from OxMaint deployed property data, 2023–2024.
Building the Business Case: What Ownership Committees Actually Want to See
Asset managers and ownership committees reviewing a CMMS investment proposal evaluate four questions in sequence. Answering all four with property-specific data — rather than industry benchmarks — is the difference between a proposal that passes and one that is deferred. The framework below shows exactly what data each question requires and which OxMaint report generates it. Book a demo to have OxMaint model the answers to all four questions from your property's actual maintenance records before you enter the ownership meeting.
We built the business case using OxMaint's analytics data from our first 60 days of deployment — before we even presented to ownership. The true-cost analysis showed $312,000 in annual reactive costs that had never appeared in a single budget report. Ownership approved a multi-property expansion immediately. The ROI conversation became completely different once we had real numbers instead of projections.VP of Engineering · 3-property upscale group, Mid-Atlantic US · OxMaint deployment, Q1 2024
Frequently Asked Questions
Build the Business Case. Start the Deployment. Verify the Return.
OxMaint's team will build your property-specific ROI analysis from your maintenance event data before your first ownership meeting. Most properties are fully deployed and tracking live ROI metrics within three weeks.