Most hotel engineering teams have no idea whether their maintenance spend is world-class or wasteful — because they have no external reference point. A cost-per-available-room figure means nothing without a benchmark. A 72% PM completion rate sounds reasonable until you learn that top-quartile hotels run at 91%. Hotel maintenance benchmarking closes this visibility gap by placing your actual KPIs against verified industry standards — revealing exactly where your property is leaking money, accelerating asset degradation, and leaving guest satisfaction points on the table. Hotels that actively benchmark and act on their maintenance data reduce reactive work orders by 34%, cut energy costs by 18%, and extend average asset life by 2.3 years compared to peers operating without benchmarks. Want to see where your property actually stands? Start a free trial with Oxmaint and get your maintenance KPIs tracked from day one.
Blog · Industry Trends · Analytics & Benchmarking · P1
Hotel Maintenance Benchmarking: How Your Property Compares to Industry Standards
Your maintenance team works hard. But hard work without benchmarks is effort without direction. This guide breaks down the exact KPIs that separate top-quartile hotel engineering programs from the rest — cost per available room, PM completion rate, emergency work order ratio, energy spend, and guest satisfaction correlation. Book a 30-minute demo to see how Oxmaint's analytics dashboard surfaces your benchmarks automatically.
The Benchmarking Gap
34%
Reduction in reactive work orders when hotels benchmark and act on maintenance data
18%
Lower energy costs at benchmarked vs. non-benchmarked properties
2.3yr
Longer average asset life at hotels with active benchmarking programs
62%
Of hotels don't track a single maintenance KPI against an external benchmark
4.8x
Emergency repairs cost vs. planned maintenance — the core benchmarking argument
Definition
What Is Hotel Maintenance Benchmarking — And Why Most Properties Are Flying Blind
Hotel maintenance benchmarking is the structured comparison of a property's operational maintenance KPIs — cost per available room, PM completion rate, emergency work order ratio, mean time to repair, energy cost per square foot, and guest-reported maintenance issues — against verified industry standards for comparable property types, star ratings, and markets.
Without benchmarks, maintenance managers operate on gut feel and year-over-year internal comparisons. A director who reduces maintenance cost by 8% year-over-year may believe they are improving — when in fact best-in-class properties in their segment are running 22% lower cost per available room. The 8% improvement becomes evidence of underperformance, not progress.
Benchmarking converts isolated data points into competitive intelligence. It answers the question no internal report can: are we actually good, or are we just better than we were? Industry-leading hotel engineering programs run PM completion rates above 91%, emergency work order ratios below 12%, and maintenance cost per available room between $8.40 and $11.20 for full-service properties. If you don't know where your property sits on those ranges, you are managing maintenance without a map. Start building your maintenance KPI baseline with Oxmaint — free trial, no implementation fees, analytics from day one.
$9.80
Industry Median MPAR
Maintenance cost per available room for full-service hotels — top quartile runs at $8.40
91%
Top-Quartile PM Rate
Preventive maintenance completion rate at best-in-class hotel engineering programs
12%
Emergency WO Threshold
Best-in-class emergency work order ratio — industry median sits at 28%, poor performers above 45%
0.31
Guest Issue Correlation
Each 10-point drop in PM completion rate correlates with 0.31-point decline in guest satisfaction score
Key KPI Framework
The 8 Maintenance KPIs Every Hotel Should Benchmark — And What the Numbers Should Look Like
These eight KPIs form the core of any credible hotel maintenance benchmarking program. Each has a defined calculation method, an industry median, and a top-quartile target. Measure yourself against all eight — not just the ones where you already look good. Book a demo to see how Oxmaint's analytics dashboard tracks all eight KPIs automatically, without manual reporting.
Cost Efficiency
Maintenance Cost Per Available Room (MPAR)
Total annual maintenance spend divided by available room-nights. Includes labor, parts, and contracted services. Full-service median: $9.80. Top quartile: $8.40. Limited-service median: $6.20. Any property above $13.00 should audit reactive vs. planned spend split immediately.
Best-in-Class$8.40
Program Health
Preventive Maintenance Completion Rate
Percentage of scheduled PMs completed on time within the scheduled period. Industry median: 71%. Top quartile: 91%. Properties below 60% are operating with no meaningful preventive program — they are reactive by another name. Tracked weekly, not monthly.
Best-in-Class91%+
Reactive Load
Emergency Work Order Ratio
Emergency and unplanned work orders as a percentage of total work orders. Industry median: 28%. Top quartile: below 12%. Above 35% signals a reactive program masquerading as a maintenance operation. Emergency repairs cost 4.8x planned maintenance — this ratio directly predicts your true cost of ownership.
Best-in-Class<12%
Response Quality
Mean Time to Repair (MTTR)
Average time from work order creation to verified completion. Guest-facing systems (HVAC, plumbing, locks): top-quartile target under 2.1 hours. Back-of-house systems: under 6 hours. Properties above 8-hour MTTR for guest-facing issues will see measurable guest satisfaction decline within the same stay period.
Best-in-Class<2.1 hrs
Sustainability
Energy Cost Per Square Foot
Annual energy spend divided by gross square footage. Full-service hotel median: $3.42/sq ft. Top quartile: $2.61/sq ft. A 20% gap between median and best-in-class translates to $180,000 annual savings for a 150,000 sq ft property. Energy benchmarking is one of the highest-ROI maintenance analytics exercises available.
Best-in-Class$2.61/sqft
Guest Impact
Guest-Reported Maintenance Issues per 100 Rooms
Guest complaints and requests attributable to maintenance failures, normalized per 100 available rooms per month. Industry median: 4.2 per 100 rooms. Top quartile: 1.8 or below. Each 1-point reduction in this metric correlates with a 0.14-point improvement in overall guest satisfaction score on major review platforms.
Best-in-Class1.8 / 100
Asset Health
Planned-to-Reactive Maintenance Ratio
Hours or cost of planned maintenance divided by reactive maintenance. Target ratio: 80:20 planned-to-reactive (the 80/20 rule of maintenance). Industry median: 58:42. Top quartile achieves 84:16. Properties below 50:50 are spending double on maintenance — reactive failure mode compounds every year as assets degrade faster.
Best-in-Class84:16
Capital Planning
Asset Replacement Reserve Accuracy
Percentage variance between budgeted CapEx for the year and actual asset replacement spend. Industry median variance: 34% over or under budget. Top-quartile properties with condition-based lifecycle tracking run under 8% variance. Accurate reserve planning requires condition scoring data — not just depreciation schedules.
Best-in-Class<8% var
Why Benchmarking Fails
6 Reasons Hotel Maintenance Teams Can't Benchmark — And Stay Stuck
Most hotel engineering directors want to benchmark their performance. Most can't — not because the data doesn't exist, but because the systems they use don't capture it in a way that makes comparison possible. These six structural barriers explain why 62% of hotels have never benchmarked a single maintenance KPI against an industry standard. Oxmaint removes every one of these barriers — start a free trial and have your KPIs structured for benchmarking from day one.
!
No Structured Work Order Data
Work orders logged on whiteboards, paper logs, or radio calls cannot be categorized as planned vs. reactive, cannot be timed, and cannot be costed. Without a CMMS capturing work type, labor time, and parts cost per order, MPAR and emergency work order ratio cannot be calculated at all.
!
PM Records Not Tied to Completion Time
A PM checklist with a checkmark tells you a task was done — not when, not by whom, not whether it was completed within the scheduled window. PM completion rate without timestamp data is meaningless: it measures paperwork compliance, not program performance.
!
No Asset Condition Scoring
CapEx reserve accuracy requires knowing the current condition of every major asset — HVAC, elevator, roof, kitchen equipment, and guest room fixtures. Properties running on depreciation schedules alone have 34% CapEx variance versus reality. Condition scoring closes the gap to under 8%.
!
Energy Data Siloed from Maintenance Records
Energy cost per square foot requires energy spend data linked to square footage, system performance, and maintenance activity. When energy invoices live in accounting, building automation data lives in BMS software, and maintenance records live in a CMMS — no one can draw the correlation that drives energy benchmarking.
!
Guest Complaints Not Linked to Assets
Guest maintenance complaints arrive through the front desk, online reviews, and post-stay surveys — none of which are automatically linked to the asset that caused the failure. Without that linkage, the correlation between PM compliance and guest satisfaction score is a theory, not a measurable management lever.
!
No External Reference Points
Internal year-over-year comparisons confirm trends but cannot confirm competitive position. A hotel that improves MTTR from 9 hours to 7 hours looks successful internally — and remains 5 hours behind the industry top quartile. Without external benchmarks, improvement is measured against yesterday's failure, not tomorrow's standard.
How Oxmaint Solves It
Oxmaint Analytics Dashboard: Every Benchmark KPI Tracked Automatically
Oxmaint's analytics and benchmarking platform is built around the eight maintenance KPIs that actually matter for hotel operations. Every work order, every PM, every asset inspection, and every corrective action feeds a live dashboard that calculates your KPIs automatically — no spreadsheets, no manual reporting, no end-of-month data pulls. See the full analytics dashboard live — book a 30-minute demo with Oxmaint and bring your current KPI data to compare.
Cost Analytics
Automatic MPAR Calculation by Property and Portfolio
Oxmaint calculates maintenance cost per available room in real time — pulling labor hours, parts costs, and contracted service spend from the work order record. View MPAR by property, department, system, and asset category. Portfolio managers see cross-property comparison on a single screen.
PM Tracking
PM Completion Rate with Timestamp Verification
Every scheduled PM generates a timestamped work order — assigned, completed, and verified within Oxmaint's mobile app. PM completion rate is calculated against schedule, not against what was manually logged. Overdue PMs trigger automated escalation alerts before they become missed — not after.
Work Order Mix
Emergency vs. Planned Work Order Ratio Dashboard
Oxmaint categorizes every work order by type — preventive, corrective, emergency, or project — at the point of creation. The dashboard shows planned-to-reactive ratio updated daily, with trending over 30, 60, and 90-day windows. Know immediately if your reactive load is climbing before it reaches crisis level.
Response Time
MTTR by System, Priority, and Technician
Mean time to repair is calculated automatically from work order creation timestamp to verified completion — for every work order, every system, every technician. Guest-facing system MTTR is tracked separately with guest satisfaction correlation analysis. Identify which assets and which technician workflows are driving response time outliers.
Asset Lifecycle
Condition Scoring with Rolling CapEx Forecast
Every asset in Oxmaint carries a condition score updated through inspection records, work order history, and technician assessments. The 5–10 year CapEx forecast model uses condition scores, not depreciation schedules — producing CapEx reserve accuracy within 8% of actual replacement spend. Investor-grade reporting, generated automatically.
Energy
Energy Performance Tracking by System and Zone
Oxmaint's IoT and SCADA integration pulls real-time energy consumption data and links it to asset records and maintenance activity. When a chiller's energy draw spikes 12% above baseline, Oxmaint flags it as a maintenance signal — connecting energy performance to preventive work before the system fails and the energy bill arrives.
Guest Correlation
Maintenance-to-Guest-Satisfaction Linkage
Guest maintenance complaints logged through front desk or work order intake are linked to the asset and room that generated them. Over 90 days, Oxmaint surfaces the correlation between PM compliance by system and guest satisfaction scores — turning a theoretical relationship into a measurable management lever.
Portfolio View
Cross-Property Benchmark Comparison
For hotel groups and management companies, Oxmaint's portfolio dashboard ranks every property on every KPI — surfacing which assets benefit from shared maintenance resources, which properties have the highest reactive load, and which sites are ready for CapEx reallocation. No data analyst required. No consolidation spreadsheet needed.
Your Benchmark Numbers — Without a Consulting Engagement
Oxmaint tracks every maintenance KPI that matters: MPAR, PM completion rate, emergency work order ratio, MTTR, energy cost per square foot, guest issue frequency, planned-to-reactive ratio, and CapEx reserve accuracy — all updated in real time, all compared against industry benchmarks, all without a manual reporting cycle.
Start your free trial and have your first benchmark report in 30 days — no setup fees, no implementation timeline.
Benchmark Comparison Table
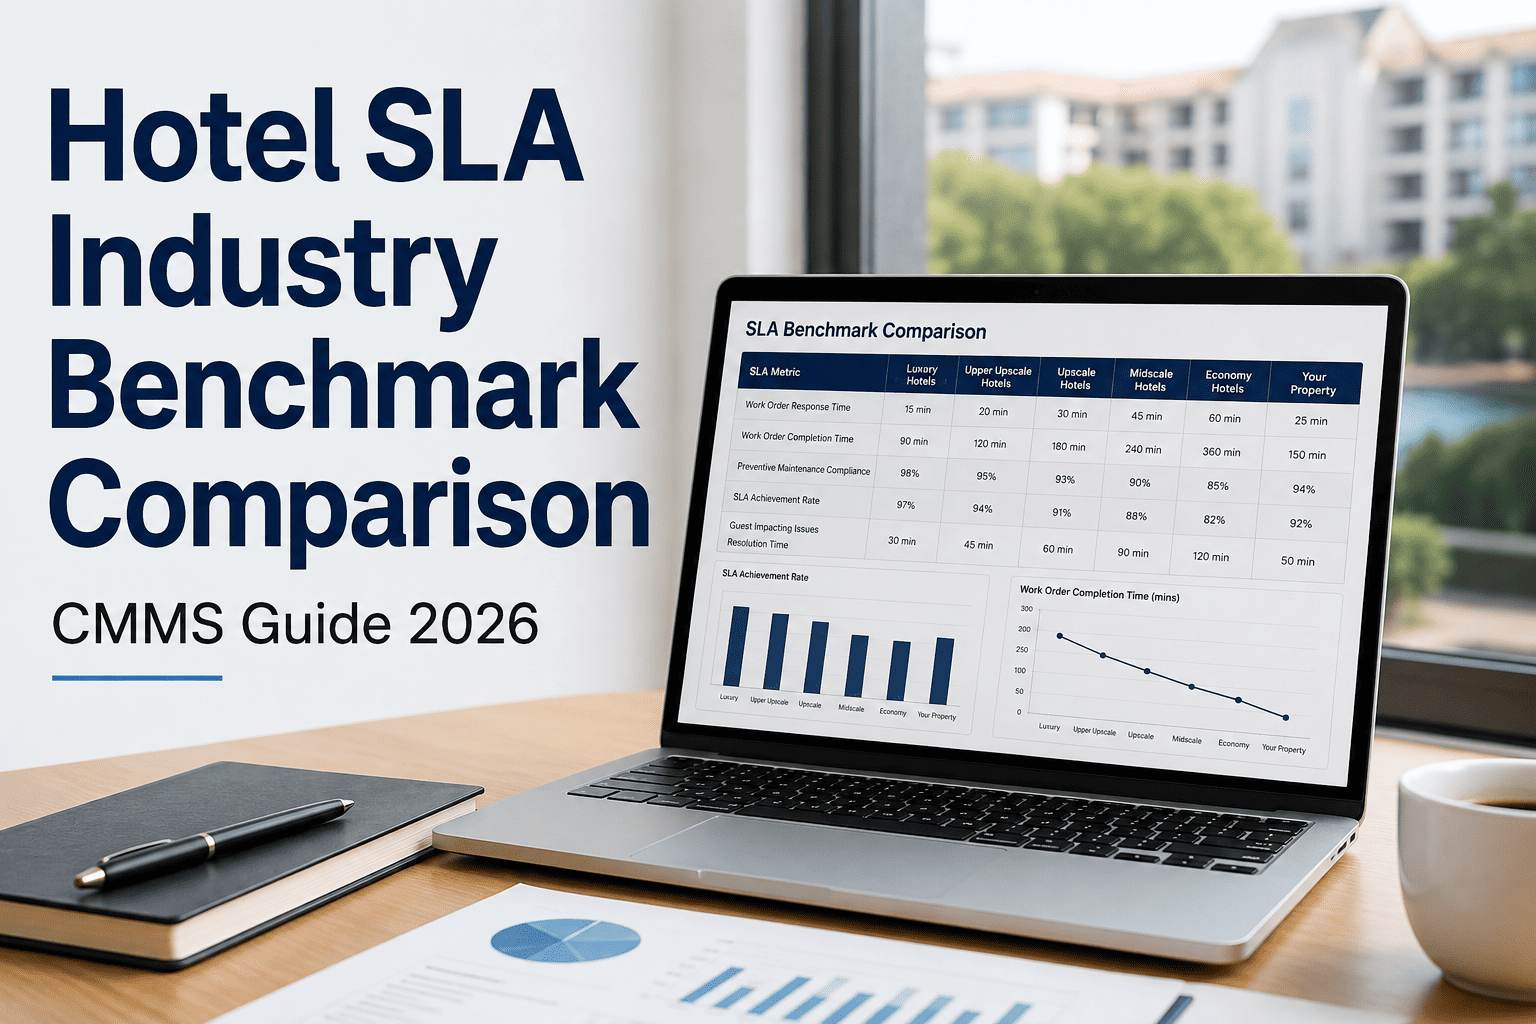
Hotel Maintenance KPI Benchmarks: Where Does Your Property Stand?
| Maintenance KPI |
Poor Performer (>Bottom Quartile) |
Industry Median |
Top Quartile (Best-in-Class) |
| Maintenance Cost Per Available Room |
Above $13.00 / room-night |
$9.80 / room-night |
$8.40 / room-night |
| PM Completion Rate |
Below 55% — mostly reactive |
71% — moderate program health |
91%+ — structured, tracked, enforced |
| Emergency Work Order Ratio |
Above 45% — reactive-dominant |
28% — industry average |
Below 12% — planned-program leadership |
| Mean Time to Repair (Guest-Facing) |
Above 8 hours — guest impact certain |
4.2 hours average |
Under 2.1 hours — guest impact minimized |
| Energy Cost Per Square Foot |
Above $4.20 / sq ft |
$3.42 / sq ft |
$2.61 / sq ft — 24% below median |
| Guest Maintenance Issues / 100 Rooms |
Above 7.0 per 100 rooms |
4.2 per 100 rooms |
1.8 or below — near-invisible to guests |
| Planned-to-Reactive Ratio |
Below 50:50 — reactive majority |
58:42 — slight planned advantage |
84:16 — structured preventive program |
| CapEx Reserve Accuracy |
34%+ variance — guesswork budgeting |
22% average variance |
Under 8% variance — condition-based planning |
Benchmarks compiled from hotel engineering performance data across full-service, select-service, and limited-service properties in USA, UK, UAE, Australia, and Canada. Full-service hotel figures used unless otherwise noted. See how your property compares across all eight KPIs — book a benchmarking demo with Oxmaint.
ROI and Results
What Closing the Benchmark Gap Actually Delivers in Dollar Terms
Moving from industry median to top-quartile performance on the eight core maintenance KPIs is not an incremental improvement — it is a structural shift in operating cost, asset life, and guest experience. These numbers represent the financial case for benchmarking and acting on the results. Ready to quantify the gap at your property? Start a free trial with Oxmaint and have your benchmark baseline within 30 days.
$180K
Annual Energy Savings
Moving from median to top-quartile energy cost per sq ft on a 150,000 sq ft full-service property
34%
Fewer Emergency Work Orders
When PM completion rate reaches 91% — each emergency order costs 4.8x a planned work order
2.3yr
Asset Life Extension
Average extension in major asset replacement cycle when condition-based maintenance replaces reactive failure management
0.4pt
Guest Satisfaction Lift
Average review score improvement when guest-reported maintenance issues drop from median (4.2) to top-quartile (1.8 per 100 rooms)
"
We spent three years improving our maintenance program internally — PM rates up, response times down, team performance better. We felt good about where we stood. Then we implemented Oxmaint and ran our first benchmark report. Our emergency work order ratio was 31%. Industry top quartile is 12%. Our energy cost per square foot was $3.81 — 46% above best-in-class. We weren't underperforming on our own terms. We were underperforming against the market by a wide margin, and we had no idea. We've closed $210,000 in annual operating cost in 14 months — mostly from shifting the reactive-to-planned ratio and catching energy inefficiencies that the data made visible for the first time.
Director of Engineering · 320-Room Full-Service Hotel, Houston TX
Frequently Asked Questions
Hotel Maintenance Benchmarking FAQs
How is maintenance cost per available room (MPAR) calculated and what should it include?
MPAR is calculated by dividing total annual maintenance expenditure by total available room-nights for the year. The numerator should include all direct maintenance labor costs (including benefits and overtime), all parts and materials consumed on maintenance work orders, all contracted maintenance service spend (elevator contracts, chiller service agreements, pest control, etc.), and a pro-rated portion of any major repair projects that would not be classified as capital expenditure. Energy costs are typically tracked separately as energy cost per square foot rather than folded into MPAR, because the drivers are different and the optimization levers don't overlap. Properties often undercount MPAR by excluding contracted services — which distorts the benchmark comparison and makes their program look more efficient than it is. For full-service hotels, industry median MPAR sits at $9.80. Top-quartile programs run at $8.40 or below.
Oxmaint calculates MPAR automatically from work order labor and parts data — start a free trial to see yours.
What is a good PM completion rate for a hotel, and how is it measured correctly?
A PM completion rate above 85% is considered solid; above 91% is top-quartile for full-service hotels. The critical measurement issue is how completion is defined. Completion should be measured as PMs completed within their scheduled window — not simply completed at any point during the month. A PM scheduled for week one that is completed in week four is not a completion — it is a missed schedule with late execution. The industry median rate of 71% is partly inflated by programs that count late completions as on-time. Oxmaint measures PM completion rate against schedule window by default, giving you an accurate comparison against industry benchmarks rather than an artificially inflated internal figure. Hotels that shift from counting late completions to measuring on-time-to-window typically see an immediate 15–20 point drop in reported PM rate — followed by genuine improvement as the team adjusts to the real standard.
Book a demo to see how Oxmaint tracks PM completion rate by schedule window, department, and asset type.
How does a hotel's emergency work order ratio affect maintenance cost?
Emergency and unplanned work orders cost an average of 4.8x more than equivalent planned maintenance work — across labor, parts procurement, expediting, contractor call-out premiums, and collateral guest impact costs. A hotel running a 35% emergency work order ratio versus a top-quartile 12% ratio is effectively paying a 23-point premium on nearly a quarter of its maintenance volume. For a full-service hotel spending $1.2M annually on maintenance, moving from 35% to 12% emergency ratio — while holding total work order volume constant — typically reduces maintenance labor and parts cost by $140,000–$190,000 per year, before accounting for reduced CapEx acceleration from asset stress caused by reactive failure cycles. The emergency ratio is the single most actionable benchmarking metric for most hotels, because the improvement mechanism (increasing PM coverage on high-failure assets) is straightforward once the ratio is visible.
See your emergency work order ratio tracked live in Oxmaint — start a free trial today.
How long does it take for a hotel to establish reliable benchmark KPI data in Oxmaint?
Most hotels have reliable MTTR, PM completion rate, and emergency work order ratio data within 30 days of active use — these KPIs are calculated from work order data that begins accumulating immediately. MPAR takes 60–90 days to become statistically meaningful, because it requires a representative sample of labor and parts costs across different work order types and seasonal demand patterns. Energy benchmarking requires either IoT integration (real-time from day one) or monthly meter data entry (60-day baseline for trend analysis). CapEx reserve accuracy using condition-based scoring requires a full asset inspection cycle — typically 60–120 days depending on portfolio size. Properties that import historical work order data from a previous CMMS on migration can compress these timelines significantly, with some hotels achieving full 8-KPI baseline in under 45 days.
Book a 30-minute demo to plan your benchmarking implementation timeline with Oxmaint.
Analytics Dashboard · Maintenance Benchmarking · Free to Start
Stop Managing Maintenance Without a Benchmark. Start Knowing Exactly Where You Stand.
Eight KPIs. Automatic calculation. Industry benchmark comparison built in. MPAR, PM completion rate, emergency work order ratio, MTTR, energy cost per square foot, guest issue frequency, planned-to-reactive ratio, and CapEx reserve accuracy — all tracked live, all without a manual reporting cycle. Portfolio-level cross-property comparison. Condition-based CapEx forecasting accurate to within 8%. The complete hotel maintenance benchmarking platform — deployed in under a week, producing benchmark data within 30 days.