Hotel Maintenance Cost Tracking Template: Monthly Spend by Department
By Alex Jordan on May 26, 2026
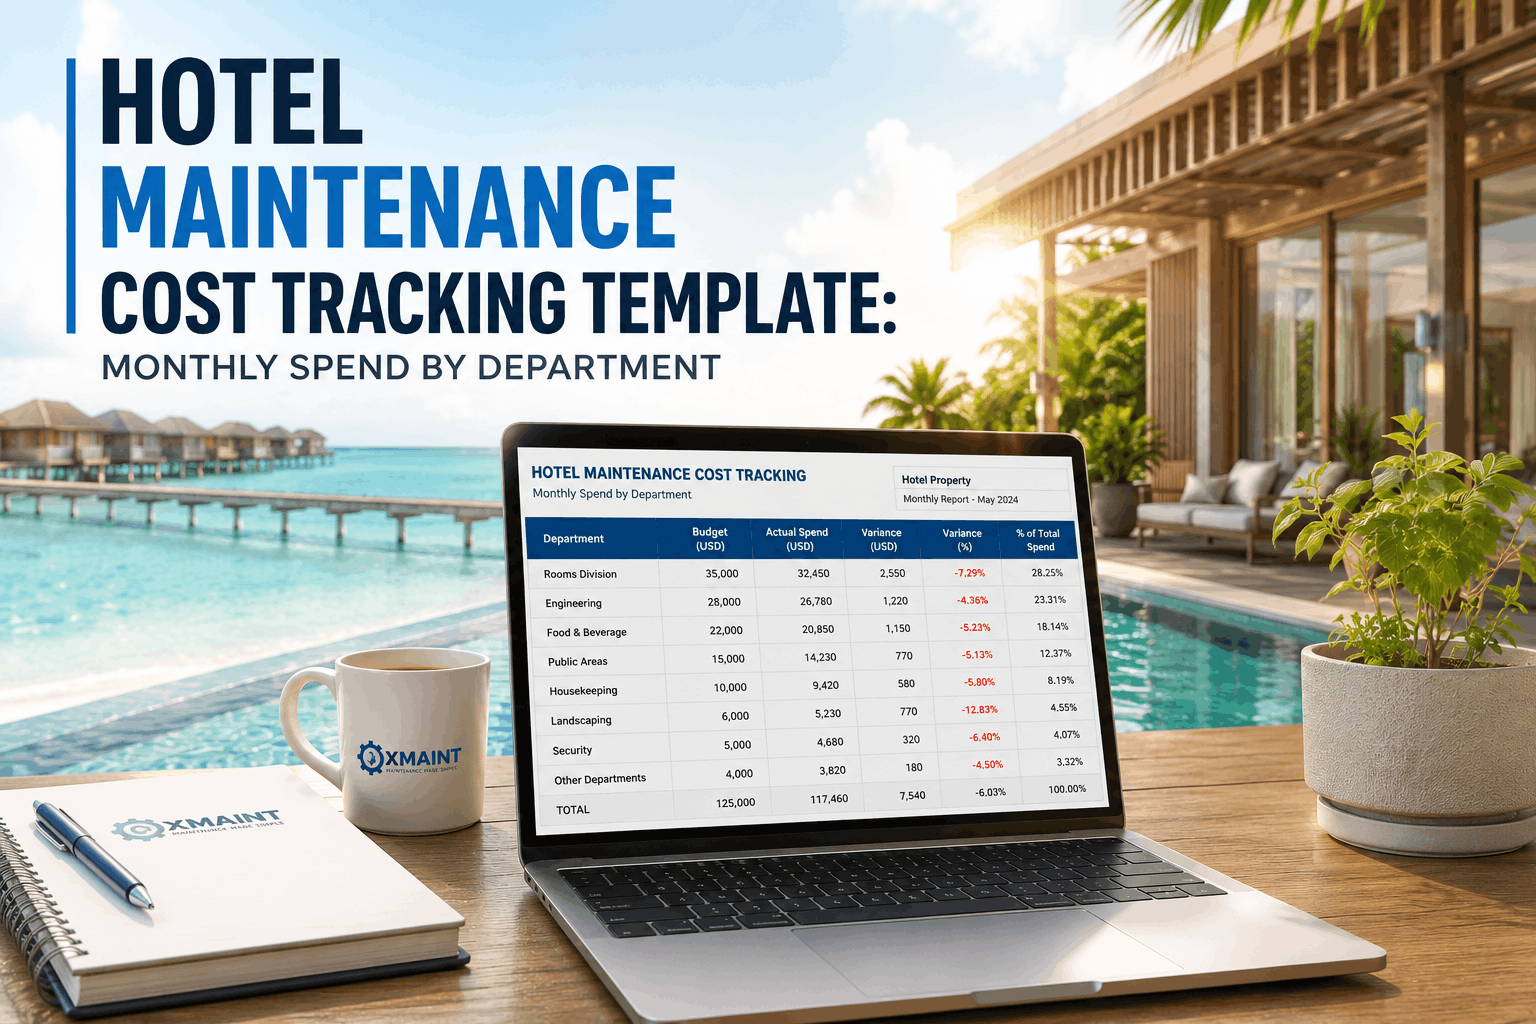
Hotel maintenance budgets spiral out of control when costs aren't tracked systematically. Without visibility into where every maintenance dollar goes — whether it's emergency HVAC repairs, routine plumbing, kitchen equipment service, or facility upgrades — general managers can't forecast accurately or identify cost overruns until they're massive. A structured monthly maintenance cost tracking system separates planned preventive maintenance spending from reactive emergency costs, stratifies expenses by department (engineering, housekeeping, F&B), and compares budgeted vs. actual spending monthly to catch variance before it impacts annual forecasts. Oxmaint's free hotel maintenance cost tracking template provides a month-by-month dashboard showing spend patterns, emergency repair trends, and cost-per-room metrics that let GMs and CFOs make data-driven decisions about preventive maintenance investment, capital planning, and vendor performance evaluation.
Oxmaint · Free Hotel Template · Cost Tracking & Analytics
Free Hotel Maintenance Cost Tracking Template — Monthly Spend by Department & Asset Class
Excel dashboard tracking planned vs. emergency costs, spend by department, variance analysis, and cost-per-room benchmarking. Identify budget overruns early. Plan capital expenditures with confidence.
Monthly tracking identifies budget drift before it becomes a year-end crisis. If March spending exceeds budget by 15%, you can adjust April activities or request budget increase from ownership immediately — not discover an $80K overrun in December.
2
Benchmark Cost Per Room
Industry standard: $350-450 per room annually for full-service hotels. Track your monthly spend divided by occupied rooms to see if you're in range or overspending. Variance >15% signals operational issues needing investigation.
3
Identify Cost Drivers
Break down spend by department (HVAC, plumbing, electrical, kitchen, etc.). If electrical costs spike in summer, it might indicate AC overload. Identifying patterns helps target preventive investments to highest-impact areas.
4
Prove ROI of Preventive Maintenance
Track emergency vs. planned spending. If emergency repairs drop 40% after increasing PM investment, that ROI justifies budget for PM programs. Data convinces CFOs and ownership to fund preventive strategies.
Monthly Cost Tracking Dashboard Structure
WHAT YOUR COST TRACKING TEMPLATE CAPTURES (12-Month View)
A. Spending by Cost Category
Planned Preventive Maintenance: Scheduled inspections, filter changes, annual certifications (elevator, fire alarm, generator). Budget: ~65-70% of total. Emergency Reactive Repairs: Unplanned breakdowns, urgent fixes, premium labor rates. Budget: ~20-25% of total. Capital Expenditure (CapEx): Equipment replacement, system upgrades, renovations. Budget: ~5-15% depending on property age.
B. Spending by Department
HVAC & Mechanical: Typically 30-40% of total maintenance spend Plumbing & Water Systems: 15-20% of total Electrical & Lighting: 10-15% of total Kitchen Equipment: 10-15% of total Elevators & Vertical Transport: 5-8% of total Building Exterior & Structural: 10-15% of total
C. Variance Analysis
Budget vs. Actual: Compare planned spend to actual. Flag variances >10%. Month-to-Month Trends: Is spend increasing or stabilizing? Unusual spikes need investigation. Year-to-Date Cumulative: Track total spend through the year against annual budget. Projection at month 6 informs expectations for final months.
D. Key Performance Metrics
Cost Per Occupied Room (CPOR): Monthly spend ÷ occupied rooms. Industry benchmark: $29-38/room/month. Emergency vs. Planned Ratio: % of emergency spending. Goal: <25% of total. Vendor Performance: Cost per contractor. Identifies high-cost vendors needing negotiation.
"We were budgeting $400K annually for maintenance but had no idea if we were on track until December — by then, we'd overspent $60K and scrambled to cut capital projects. After implementing monthly cost tracking, we caught a 22% variance in February and adjusted resources immediately. The template showed our plumbing costs were triple the benchmark, which revealed a chronic low-grade leak we kept patching instead of fixing properly. One major repair prevented a disaster. Now ownership sees month-by-month P&L for maintenance. Transparency has changed how we invest in preventive work."
Sarah M. — Hotel CFO
250-room luxury hotel, Northeast US
Monthly Spending by Department — Typical Breakdown
HVAC & Mechanical
35%
Cooling/heating systems, compressors, chillers, boilers. Highest-cost category. Summer peaks (AC heavy usage) drive increased spend.
Plumbing & Water
18%
Pipes, fixtures, water heater, backflow testing, drain cleaning. Winter peaks (freezing risk) and emergency water damage.
Electrical & Lighting
12%
Panels, circuits, lighting, emergency power, generator. Usually stable throughout year; spikes with emergency outages.
Kitchen Equipment
13%
Ovens, grills, refrigeration, dishwashers, hood systems. Heavy usage drives maintenance. Food service compliance required.
Notes: Kitchen overage due to hood system deep cleaning (scheduled PM). Plumbing under due to deferred roof gutter work. HVAC slightly elevated — monitor for cooling season demand.
Using Cost Data for Decision-Making
1. Identify Chronic Cost Problems
If one department consistently exceeds budget, it indicates either preventive failures (missing maintenance causing emergency repairs) or vendor cost issues. Six-month trends show if it's a pattern.
2. Budget Next Year's Spending
Aggregate 12 months of actual spend. Add 5-10% contingency. This becomes your starting point for next year's budget — far more accurate than guessing based on last year's estimate.
3. Evaluate Preventive Maintenance ROI
If increasing HVAC PM spend by $5K/year reduces emergency repairs by $15K/year, that's a 3:1 ROI. Track this to justify PM investment to ownership.
4. Negotiate with Vendors
If one contractor's monthly costs are 30% above benchmarks, have a cost discussion or request competitive bids. Data-backed conversations are more effective than vague concerns.
Download Your Cost Tracking Template
CHOOSE YOUR FORMAT
Excel Dashboard
12-sheet workbook with monthly cost input, automatic variance calculation, department breakdowns, and KPI charts.
Q1 How do I separate preventive maintenance costs from emergency repairs in the template?
Code each work order as "Planned PM" or "Emergency Reactive" when logging. The template auto-sorts them into separate columns, calculates the ratio, and flags if emergency % exceeds 25% threshold.
Q2 What's the industry benchmark for cost per room per month?
Q3 Should I track capital expenditure (CapEx) separately from operating maintenance expenses?
Yes — CapEx is asset replacement ($25K roof, $40K HVAC unit); operating maintenance is routine repairs/PM. Keep them in separate budget lines so you can see true maintenance costs vs. long-term capital investments.
Q4 How do I use monthly data to predict annual spend?
At month 6, calculate actual spend ÷ 6 × 12 = projected annual. If you're on track, great. If 20% over, you're projected to overspend by ~$84K annually (on a $420K budget). Adjust remaining months accordingly or request budget increase.
Q5 Can I drill down by vendor to see individual contractor costs?
Yes — the template has a Vendor Costs tab. Track spend per contractor monthly. Identify if one vendor is consistently higher and negotiate pricing or benchmark against market rates.
Q6 Should seasonal variations (winter heating, summer cooling) be adjusted in the budget?
Yes — build seasonal budget adjustments. Winter may be 15% higher (heating + weather risk), summer 20% higher (cooling demand). Quarterly budgets with seasonal variance are more realistic than flat monthly budgets.
Q7 How do I present cost tracking data to ownership/corporate?
Monthly executive summary: Total spend, spend per room, emergency % vs. goal, major cost drivers, and 1-2 key insights. Keep it to one page with charts. Show trending (is spend improving or worsening?).
Q8 Can I compare my hotel's costs to industry competitors?
Cost per room is your best benchmark. Share anonymously with hotel groups (AHLA, regional associations) or use industry reports. Know your position (above, at, or below benchmarks) to drive strategy conversations with ownership.
Track Every Maintenance Dollar — Control Your Budget
Download the free cost tracking template and start measuring maintenance spending like a business metric — not a black box. Monthly visibility into spend patterns, variance analysis, and cost-per-room metrics transforms maintenance from an afterthought into a strategic controllable expense.


.png)