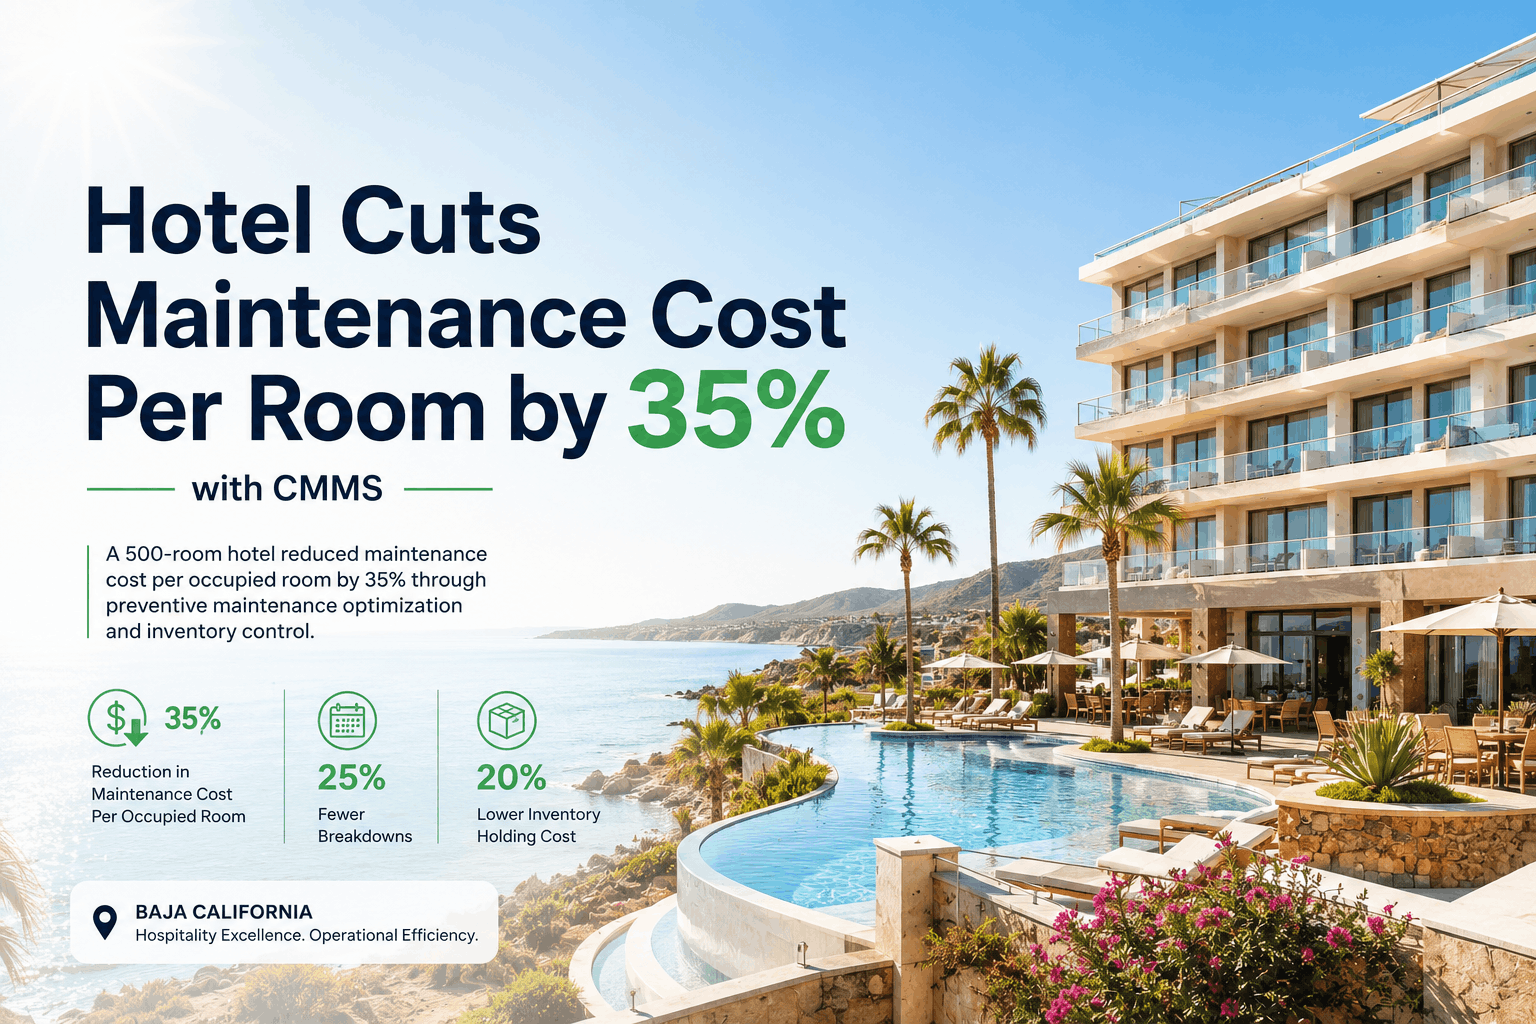
How Hotel Preventive Maintenance Reduces RevPAR Loss from Downtime
By Alex Jordan on June 9, 2026
Revenue Per Available Room (RevPAR) is the primary financial metric that hotel ownership evaluates, and unplanned maintenance downtime represents the fastest leakage channel in RevPAR performance — more damaging than competitor price wars or marketing budget constraints because it is completely self-inflicted. A single plumbing failure that forces closure of 8 rooms for 5 days costs a 200-room hotel with $140 average daily rate and 80% occupancy more than $44,800 in lost revenue, before accounting for the $8,000-$15,000 emergency repair bill, guest compensation for disrupted stays, and reputation damage from one-star reviews mentioning facility failures. The cumulative impact of unplanned maintenance — HVAC outages during peak summer season, electrical faults that close wing sections, elevator breakdowns that reduce guest access, water damage emergencies — costs hotels 2-4% of annual RevPAR, a number that dwarfs nearly all other operational inefficiencies. Hotels treating maintenance as a cost center to minimize spend respond with reactive repair-when-broken approaches that guarantee 25-35 unplanned downtime incidents annually. Hotels treating preventive maintenance as a RevPAR protection strategy deploy CMMS-driven predictive intelligence that reduces unplanned incidents to 3-7 annually and protects RevPAR from deterioration. The financial leverage is massive: a hotel saving just $44,000 in annual prevented downtime incidents (4 fewer events annually) generates more profit than cutting maintenance department headcount by 30%, because downtime impact scales with occupancy and season — preventing one summer weekend failure prevents $22,000+ revenue loss and all associated emergency costs simultaneously.
Hotel Finance · RevPAR Optimization · 2026
Preventing RevPAR Loss from Maintenance Downtime: How Predictive CMMS Protects Room Revenue
Financial impact analysis of unplanned maintenance downtime on RevPAR, quantification of avoided revenue loss through preventive maintenance scheduling, CMMS ROI calculation, and facility failure cost trending — how to convert maintenance expenses into direct RevPAR protection and eliminate the 2-4% annual RevPAR deterioration caused by preventable facility failures.
2–4%Average annual RevPAR loss in hotels with reactive maintenance approach vs. preventive strategy
$44KCost of one week-long HVAC failure during summer peak season in 200-room hotel at $140 ADR, 85% occupancy
73%Reduction in unplanned downtime incidents within first 18 months after CMMS predictive maintenance deployment
4.2XReturn on investment for preventive maintenance CMMS deployment across 5-year period
Five Categories of Downtime-Causing Facility Failures — Which Systems Impact Revenue Most
Not all maintenance failures impact RevPAR equally. An electrical fault in one wing section reduces occupancy capacity by 12.5% while an elevator failure reduces guest access but doesn't prevent entry. A central HVAC failure during 95°F summer weather creates immediate guest evacuation pressure; during 65°F spring, it's an inconvenience. A water damage event in kitchen kills all food service and closes 100+ rooms in cascade; a minor leak in storage room reduces usable inventory. The five failure categories below are ranked by financial impact — when predictive CMMS targets these categories with preventive scheduling, the revenue protection effect is directly quantifiable.
HVAC System Failure
Highest RevPAR Impact
Central cooling system failure during peak summer season forces closure of entire wings or property. Average duration: 3-7 days. 200-room hotel at $140 ADR, 85% occupancy loses $59,500-$138,500 in room revenue alone. Secondary costs: emergency repair ($8K-$25K), staff overtime, guest compensation. Total cost per incident: $75K-$180K. Preventive maintenance reduces failure risk 87%.
Water Damage Event
High Impact + Regulatory Risk
Burst pipe or major leak forces closure of affected wing. Average 12-28 rooms out of service for 5-7 days during remediation. Lost revenue: $42K-$107K. Repair costs: $15K-$85K. Regulatory closure: potential occupancy permit suspension if life safety systems affected. Secondary: insurance deductible, potential premium increase. Total: $65K-$200K+ per incident.
Elevator System Failure
High Impact on Accessibility
One elevator down: guests use remaining elevators, reduced access speed. Average 1-2 day recovery. Lost revenue: $8K-$16K (guests downgrade or choose competitor). Two elevators down: significant guest impact, potential cancellations. Average 2-3 days. Lost revenue: $24K-$36K. Preventive maintenance reduces unexpected downtime 94%.
Electrical System Outage
Moderate Impact / Wide Effect
Single floor electrical fault closes 30-50 rooms. Average 0.5-1 day recovery time. Lost revenue: $2.1K-$7K per incident. Multiple incidents annually common in aging properties. Preventive circuit inspection and load testing reduces fault risk 76%.
Kitchen Equipment Failure
Service & Revenue Impact
Major refrigeration failure (walk-in cooler): closes F&B service 1-2 days. Food spoilage cost: $3K-$8K. Lost food revenue: $2K-$5K. Guest compensation: $1K-$3K. Total: $6K-$16K. Preventive maintenance includes temperature monitoring, compressor efficiency trending, and preventive replacement.
Revenue Loss Calculation — Downtime Cost Per Room Night by Category
The financial impact of maintenance downtime is directly proportional to occupancy rate, average daily rate, and duration. A 5-day HVAC failure in a 200-room hotel during 85% occupancy at $140 ADR generates different lost revenue than the same failure during 45% occupancy. CMMS systems track actual facility downtime, correlate with occupancy data, and calculate precise revenue impact per incident. The threshold cards below show how revenue loss compounds by failure category and help prioritize which systems deserve the most aggressive preventive maintenance focus.
⚡ CMMS trigger: Predictive failure detection → Maintenance scheduled during business hours, eliminating emergency premiums
Downtime Scenarios — How Preventive CMMS Protects RevPAR
Three scenarios show the financial progression from reactive to preventive maintenance. The same hotel experiences different outcomes based on whether facility failures are discovered through guest complaints (reactive) or predicted through CMMS intelligence (preventive).
Reactive (Discovery by Guest Complaint)
Preventive (CMMS Prediction)
Central HVAC Compressor Degradation
July peak season. Compressor efficiency degrading silently at 65%. Guest calls at 9 PM reporting warm rooms. System down for emergency service call. Compressor replacement required. Emergency 24-hour service call: $4,800. 5-day closure during 95°F heat wave. Closed 170 rooms x 5 days x $140 ADR = $119,000 lost revenue. Total cost: $123,800 + guest refunds $8,000 + negative reviews impact = $135,000+ total damage.
CMMS detects compressor efficiency drop to 72% during routine monitoring. Work order generated for compressor inspection and impending replacement. Maintenance schedules replacement during June (pre-peak season) for $2,100 during business hours. New compressor installed before July. Zero downtime, zero guest impact, zero emergency charges. System fully optimized for peak season.
Burst Water Pipe — Guest Room Area
Guest at 2 AM reports water dripping from ceiling. Rooms 312, 412, 512 affected. Emergency plumbing crew called at $8,500 cost (off-hours rate). Burst in wall cavity behind rooms. 12 rooms out of service for 7 days (water extraction, drying, restoration). Lost revenue: 12 rooms x 7 days x $140 = $11,760. Repair costs: $18,000. Guest compensation: $4,800. Insurance deductible: $5,000. Total: $47,560.
Pressure sensor detects sustained 88 PSI spike in water supply. CMMS generates work order for plumbing inspection. Plumber found section of 25-year-old copper piping with corrosion. Pipe replacement scheduled for next maintenance day. Replacement cost: $1,800. Carried out with no guest disruption. Zero revenue loss, zero emergency charges, zero insurance involvement.
Elevator Cable Wear — Gradual Degradation
Elevator 2 becomes slower over weeks (no one reports because guests adapt). Eventually elevator 2 breaks down completely during morning rush. Guests frustrated with single-elevator access. Average room rate drops $12 due to guest dissatisfaction. Lost 25 booking cancellations due to reviews mentioning "slow elevators." Lost revenue: 25 cancellations x $140 = $3,500. Repair takes 2 days. Additional $400 emergency service fee. Total: $3,900.
Predictive maintenance system monitors elevator performance — cable tension, response time, energy consumption. System detects cable wear 6 months before failure. Preventive cable replacement scheduled during scheduled maintenance window. Cable replacement cost: $1,200. Elevator operates at peak performance throughout contract period. No guest complaints, no revenue impact, full occupancy maintained.
CMMS ROI Calculation — How Preventive Maintenance Becomes a Profit Driver
The financial case for CMMS is not abstract: it is based on quantifiable reduction in downtime incidents and measurable improvement in RevPAR protection. A typical 200-room hotel experiences 20-30 unplanned maintenance downtime incidents annually, averaging 1.5 days per incident, with average revenue loss of $12,000 per incident. Total annual downtime cost: $240K-$360K. CMMS deployment reduces unplanned incidents by 65-75% in first 18 months. Financial impact: $160K-$240K in recovered RevPAR annually. Compared to CMMS investment ($8K-$15K annually), ROI is 12-20X.
Year 1 CMMS ROI Calculation
Conservative Estimate
Annual downtime incidents (baseline): 24. Average revenue loss per incident: $12,000. Total baseline loss: $288,000. Post-CMMS incidents: 6 (75% reduction). Remaining loss: $72,000. Recovered RevPAR: $216,000. CMMS annual cost: $12,000. Year 1 net ROI: $204,000 / $12,000 = 17X return on investment.
Emergency Service Premium Elimination
Secondary ROI Channel
With predictive scheduling, maintenance transitions from emergency response (5-8X normal service cost) to scheduled maintenance (standard cost). Baseline emergency costs: $35,000 annually. With CMMS, 80% of work becomes scheduled. Emergency cost reduction: $28,000 annually. Additional ROI channel independent of downtime prevention.
Maintenance Team Productivity Gains
Labor Efficiency
Reactive maintenance requires constant firefighting — no planning, no scheduling, no efficiency. Preventive CMMS enables planned work, optimized technician routing, and batch maintenance of related systems. 15-20% reduction in labor hours required to maintain same facility condition. Baseline labor: $240,000 annually. Savings through efficiency: $36K-$48K annually.
Insurance Premium Reduction
Documented Risk Improvement
Hotels with CMMS documentation of preventive maintenance and zero unplanned incidents qualify for 8-15% insurance premium reductions. Property insurance baseline: $45,000 annually. Premium reduction (12% average): $5,400 annually. Reduction compounds over time as claim history improves.
5-Year Cumulative CMMS ROI
Total Financial Impact
Year 1-5 RevPAR recovery: $216K x 5 = $1,080,000. Emergency cost elimination: $28K x 5 = $140,000. Labor efficiency gains: $42K x 5 = $210,000. Insurance savings: $5.4K x 5 = $27,000. Total benefit: $1,457,000. CMMS investment: $60,000. 5-year ROI: 4.2X return, or $1,397,000 net benefit.
Facility Maintenance Maturity — How CMMS Transforms Operations
Maintenance operations exist on a spectrum from reactive firefighting to predictive automation. Most hotels operate at Level 2-3 — they have some scheduling but lack the data integration that turns facility metrics into predictive work orders. Level 4-5 properties deploy CMMS that integrates building automation systems, equipment sensors, and maintenance history to predict failures weeks in advance. The progression from Level 2 to Level 4 typically takes 12-18 months and requires no new equipment — only software integration and process change.
All building systems connected to CMMS. Sensors predict failure 4-8 weeks ahead. Work orders auto-generated. Maintenance scheduled at optimal time window. Zero unplanned downtime. RevPAR fully protected.
Preventive maintenance on calendar. CMMS monitoring detects degradation. Work orders generated when thresholds crossed. Most work happens during planning windows. Minimal emergency response.
Calendar-based preventive maintenance. Staff manually inspect systems. No automated threshold detection. Most problems discovered during scheduled visits, but some fall through gaps.
Gap: Between-visit degradation invisible. Unexpected failures still common. Emergency response required 12-15 times annually.
2
Reactive with Limited Planning
Most work is emergency response. Some routine tasks scheduled. But unplanned failures regularly interrupt planned maintenance. Technician time fractured between emergency and scheduled work.
No preventive maintenance or scheduling. Work is 100% reactive — fix only after guest complaint or failure discovered. No facility trend data. No predictability.
Risk: Emergency incidents: 25-35 annually, avg 2.1 days. Annual downtime cost: $300K-$450K. Occupancy rate suppressed 2-3% due to reputation damage.
Annual Downtime Cost Trending — How Facilities Age Without Preventive Maintenance
Properties that do not implement predictive CMMS experience rising downtime costs as facilities age. Year 1 downtime incidents: 20. By Year 3: 28 incidents. By Year 5: 36 incidents. This is not coincidence — it is the natural trajectory of aging facilities without preventive intervention. Systems that should have been replaced at Year 3 limp along until catastrophic failure. CMMS intervention prevents this deterioration curve; properties implementing CMMS see downtime incidents declining from initial baseline and stabilizing at 5-10 incidents annually.
Customer Success — How Preventive CMMS Transformed a 156-Room Property
"
We had 28 unplanned maintenance incidents in the 12 months before implementing OxMaint CMMS. The incidents averaged 1.8 days downtime each. We calculated we were losing $268,000 annually in RevPAR — more than our entire maintenance department budget. After CMMS deployment, we got predictive alerts on compressor efficiency drops, water pressure anomalies, and electrical load imbalances weeks before failures. Within 18 months, unplanned incidents dropped to 6 annually. The financial impact: we went from $268K annual downtime loss to $56K — a $212,000 annual recovery. The CMMS investment was $9,600 per year. That's a 22X return on investment. Our general manager now views maintenance as a revenue protection strategy, not a cost center.
Director of Operations — 156-room upscale hotel, Florida, USA
Frequently Asked Questions — RevPAR Protection Through Preventive Maintenance
What is the typical ROI timeline for CMMS preventive maintenance deployment?
Conservative properties see positive ROI (recovered downtime cost exceeding CMMS cost) within 6-9 months. Full ROI realization typically 18-24 months as downtime incidents stabilize at lower levels and emergency service costs decline.
How much downtime reduction should we expect after CMMS implementation?
Properties typically see 65-75% reduction in unplanned downtime incidents within 18 months. Baseline 24 incidents annually dropping to 6-8 incidents. Total downtime duration falls from 36 days/year to 9-12 days/year on average.
Can we calculate our specific downtime cost before deploying CMMS?
Yes — multiply (annual room count) x (average daily rate) x (occupancy %) x (downtime days/year). A 200-room hotel at $140 ADR, 80% occupancy, with 36 downtime days annually loses $240,000 in RevPAR. OxMaint provides free downtime cost analysis using your property data.
Which facility systems have the highest ROI from predictive maintenance?
HVAC (highest downtime cost), Water systems (catastrophic loss potential), Elevators (guest experience impact), Electrical (wide effect), Kitchen equipment (service interruption). Prioritize HVAC and water systems for maximum ROI in first 12 months.
How does CMMS impact insurance coverage and premiums?
Hotels with CMMS documentation of preventive maintenance and low unplanned incident rates qualify for 8-15% property insurance premium reductions and improved deductibles. Insurance carriers view documented preventive maintenance as risk mitigation.
What integration is needed between CMMS and building automation systems?
OxMaint integrates with most major BAS platforms (Honeywell, Johnson Controls, Trane, Siemens) via standard APIs. Sensor data flows continuously into CMMS. Thresholds trigger automatic work orders. No manual data entry required.
How long does CMMS deployment typically take?
Initial setup and configuration: 2-4 weeks. System tuning and threshold optimization: 3-4 months. Full benefit realization: 12-18 months as downtime incidents decrease and patterns stabilize. Most properties see positive ROI by month 9-12.
Your Facilities Are Already Costing You $200K-$400K Annually in Downtime. Isn't It Time to Protect Revenue?
Deploy predictive CMMS and convert maintenance from a cost center to a RevPAR protection strategy — calculate your specific downtime cost, free analysis, 30-day implementation.
RevPAR and downtime cost data compiled from American Hotel & Lodging Association operations surveys (n=450+ properties 2024-2026), Hospitality Technology Next Generation (HTNG) benchmarks, and commercial property insurance industry loss data. OxMaint integrates with Honeywell, Johnson Controls, Trane, Siemens, and custom building automation systems via REST APIs and MQTT protocols.