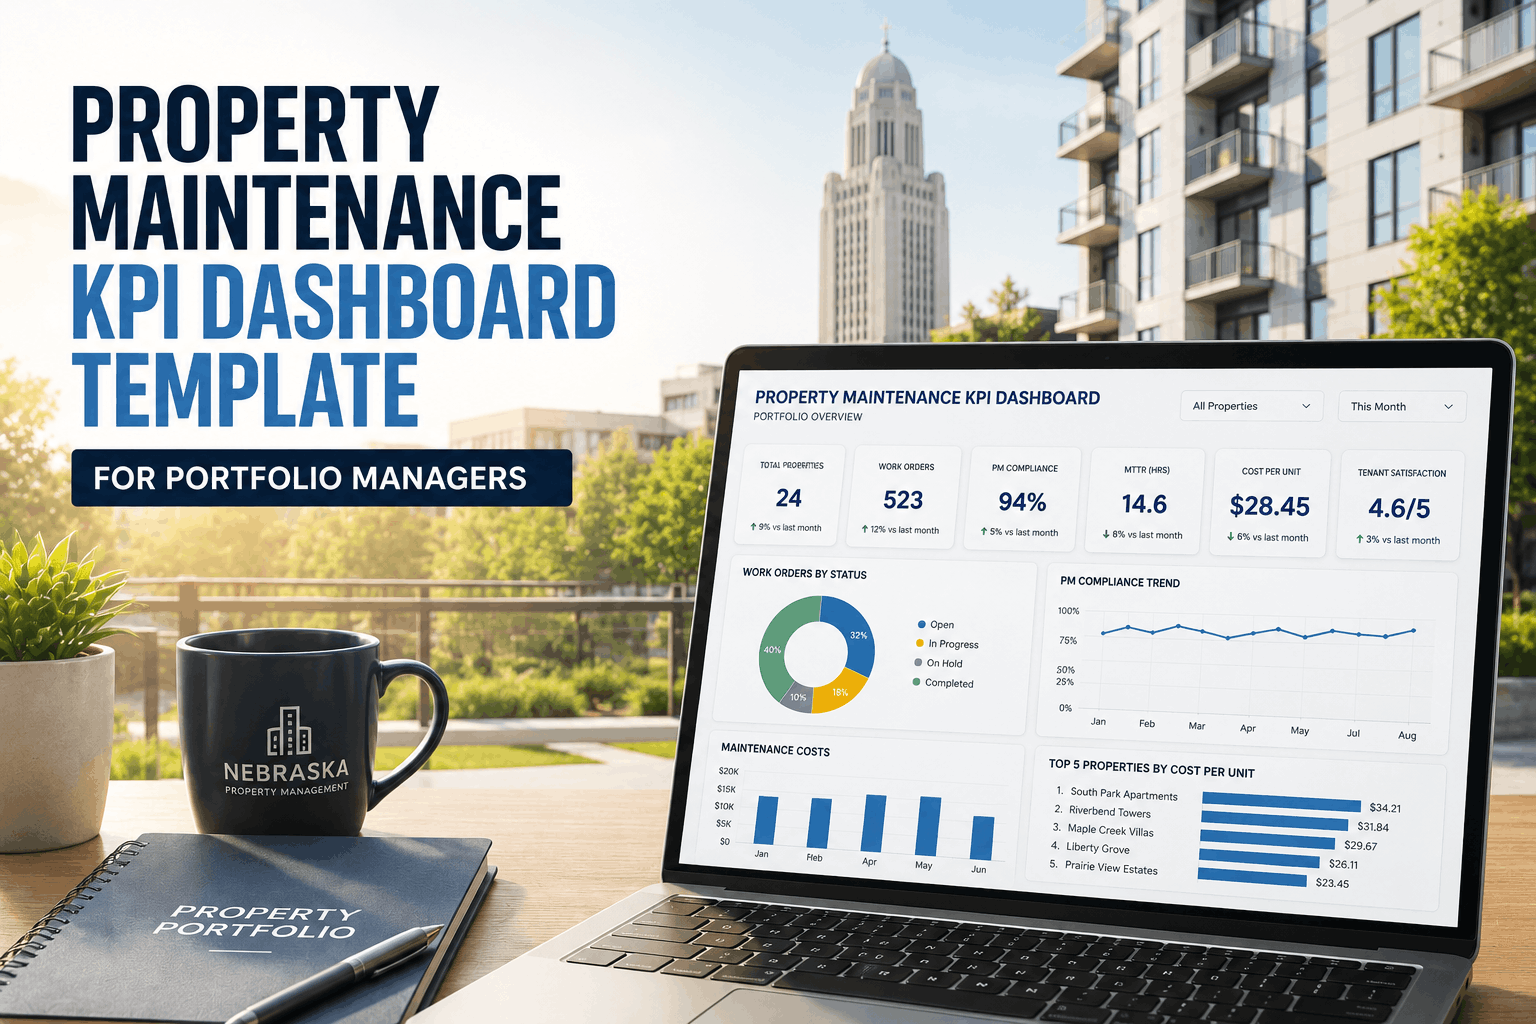
Portfolio property managers tracking maintenance KPIs across 10+ properties face a critical visibility gap: excel spreadsheets show past data weeks late, preventing real-time decisions on resource allocation, vendor performance, or maintenance strategy effectiveness. Leading property management firms tracking MTTR, PM compliance, cost-per-asset, and emergency ratios consistently outperform competitors by 20-25% on tenant satisfaction and cost control metrics. Most portfolios measure only work orders completed (vanity metric) instead of response time, quality outcomes, preventive/reactive balance, and asset reliability trends that actually drive profitability. Book a Demo to implement OxMaint's KPI dashboard template tracking MTTR, PM compliance, cost-per-unit, vendor SLA performance, and emergency ratios automatically across your entire property portfolio in real time.
Critical KPIs for Property Portfolio Management
Six Metrics That Separate Top-Performing Portfolios From Reactive Operations
Eight Property Maintenance KPIs Explained
What to Track, How to Interpret, and Industry Benchmarks
How OxMaint's Dashboard Eliminates Manual KPI Reporting
Real-Time Metrics Without Spreadsheets or Month-End Scrambles
Property management portfolios implementing comprehensive KPI dashboards improve tenant satisfaction 15-20%, reduce emergency maintenance spend 20-30%, and increase preventive maintenance compliance from 60-70% to 90%+ within 6 months. OxMaint's dashboard template calculates all eight core KPIs automatically from your work order history — no setup complexity, real-time updates, and actionable insights replacing manual monthly reporting cycles. Book a Demo to see your first KPI dashboard live today — fully configured and populated with your maintenance data within 48 hours of onboarding.
FAQ: Property Maintenance KPI Dashboards
How often should I review property maintenance KPIs?
Operational KPIs (MTTR, open work orders) daily or weekly for tactical decisions. Strategic KPIs (cost-per-unit, PM compliance trends) monthly or quarterly for planning and target adjustments.
What's a good MTTR benchmark for a residential portfolio?
12-24 hours for non-emergency maintenance. Emergency systems (HVAC in summer, plumbing) should target <4 hours. Track separately to avoid non-emergencies inflating the critical response time metric.
How do I improve PM compliance from 70% to 90%?
Track overdue PM tasks, assign accountability, and automate scheduling. Most improvement comes from eliminating rescheduled/skipped tasks through better planning and resource availability alignment.
Should I track cost-per-unit by building or by property type?
Both. By building shows outliers needing intervention. By type benchmarks new buildings against mature ones. Combine to drive strategic maintenance and capital allocation decisions.
Can I use KPI dashboards to justify staffing increases?
Absolutely. Show backlog growth, declining MTTR, PM compliance dropping — data-backed business case for resources beats intuition-based requests to executive leadership.
What KPIs matter most for tenant retention?
MTTR (how fast we respond) and first-time fix rate (quality). Combine these into tenant satisfaction score for direct correlation to renewal rates and occupancy.
How do I benchmark my portfolio against industry standards?
Compare MTTR <24 hours, PM compliance >90%, planned/reactive 70/30, cost-per-unit against BOMA standards and OxMaint customer benchmarks across your property type/size.
Can I export KPI dashboards for investor reporting?
Yes. OxMaint generates professional PDF reports with KPI trends, benchmark comparisons, and performance narratives — ready for investor updates or board presentations without manual compilation.



--free-download-2026.png)