Carbon intensity scorecards are becoming a baseline requirement for manufacturing plants that need to measure, report, and reduce their emissions footprint. When carbon performance is tracked by asset, line, or shift, plant leaders move from vague sustainability targets to specific operational actions. Maintenance teams using Sign Up Free on OxMaint can connect asset maintenance history, PM compliance rates, and inspection outcomes to the energy and emissions data that drives carbon intensity calculations. A structured carbon intensity scorecard built on accurate maintenance records closes the gap between sustainability reporting and plant-floor accountability.
Why Carbon Intensity Scorecards Require Maintenance-Level Data
Plant-wide emissions totals hide where carbon intensity is being generated. Until carbon performance is tracked at the asset and process level, reduction targets remain aspirational rather than actionable. Book a Demo to see how OxMaint helps manufacturing maintenance teams build the asset data foundation that makes carbon intensity scorecards meaningful at every level of the plant hierarchy.
Six Components of a Manufacturing Carbon Intensity Scorecard
An effective carbon intensity scorecard integrates emissions data with the operational and maintenance variables that drive it. Without maintenance data in the model, scorecard outputs reflect meter readings rather than root causes. Sign Up Free to begin connecting OxMaint asset records to your plant's carbon intensity reporting framework.
Emissions Intensity by Production Unit
Normalizing carbon output against production volume reveals which lines or shifts are running less efficiently from an emissions perspective — separating throughput-driven variance from genuine efficiency improvement or degradation.
Asset-Level Energy and Thermal Waste Contribution
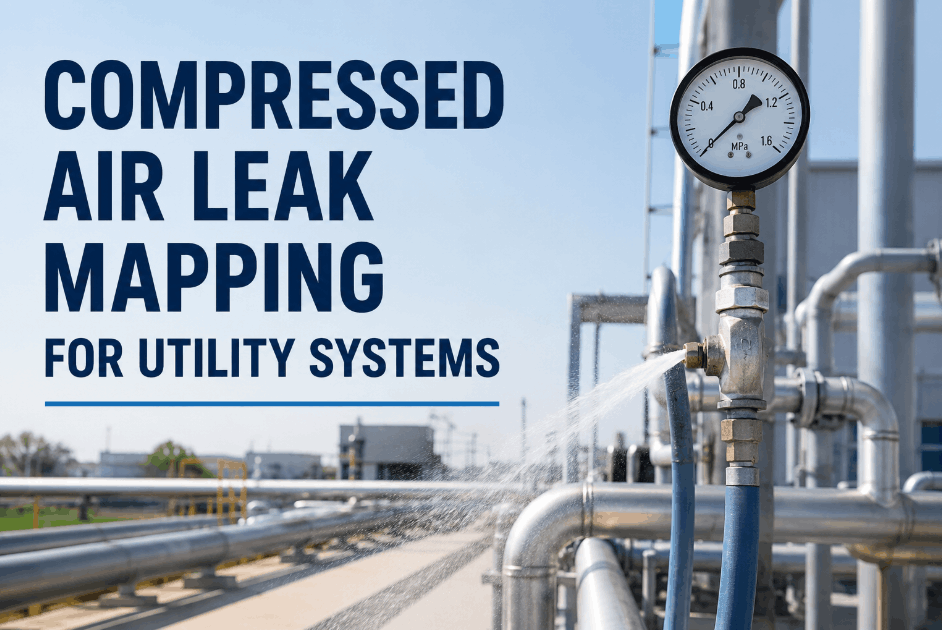
Poorly maintained motors, compressed air leaks, steam loss, and heat exchanger fouling all inflate carbon intensity at the asset level. OxMaint inspection records and corrective work orders create an audit trail connecting equipment condition to emissions performance.
PM Compliance Rate as a Carbon Proxy
Preventive maintenance compliance is a leading indicator of carbon intensity. Assets with overdue PMs consume more energy per unit of output and generate more thermal waste. OxMaint's PM compliance reporting gives sustainability managers a maintenance-driven carbon proxy they can act on.
Utility Submetering and Load Balancing Data
Submetered electricity, gas, steam, and water consumption data by process area enables precise carbon intensity calculations at the cost center level — making the scorecard actionable for plant managers, not just sustainability officers.
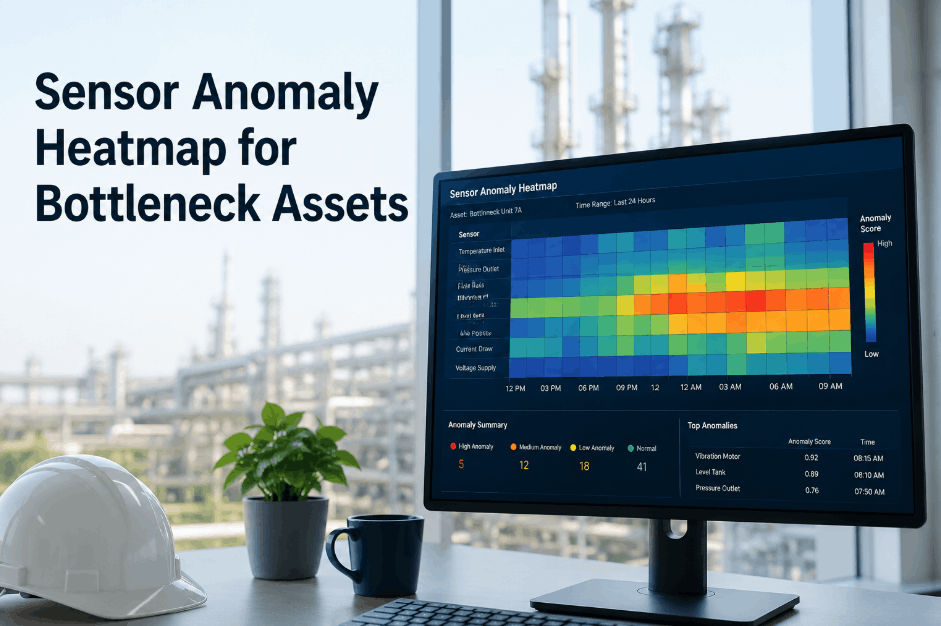
Idle Load and Demand Profile Analysis
Carbon intensity spikes during idle running periods when assets consume energy without producing output. Demand profile analysis highlights shift patterns and production gaps where idle load reduction delivers the highest carbon intensity improvement per intervention.
Scorecard Reporting and Trend Tracking
Carbon intensity scorecards only drive behavior when results are reported consistently and linked to specific improvement actions. OxMaint generates maintenance performance reports that feed directly into the operational data layer of plant carbon reporting cycles.
Carbon Intensity Drivers by Plant Asset Category
Carbon intensity does not distribute evenly across plant assets. Understanding which asset categories contribute most to emissions variance allows maintenance planners to prioritize intervention where scorecard improvement is fastest. Book a Demo to explore how OxMaint tracks asset-level maintenance compliance alongside energy and emissions metrics in a unified dashboard.
| Asset Category | Primary Carbon Driver | Maintenance Impact on Intensity | Scorecard Sensitivity | OxMaint Action Lever |
|---|---|---|---|---|
| Motor-Driven Equipment | Overload, power factor, idle running | High | Very High | Load-based PM scheduling + thermal inspections |
| Compressed Air Systems | Leak losses, pressure waste | High | High | Leak detection work orders + pressure audits |
| Steam and Heat Exchange | Steam loss, fouling, insulation failure | Very High | High | Insulation inspection + steam trap PM tasks |
| HVAC and Cooling Systems | Filter fouling, refrigerant loss | Medium | Medium | Filter change schedules + coil cleaning tasks |
| Lighting and Ancillary Loads | Operating hours, no demand control | Low–Medium | Medium | Usage-based inspection + control upgrade tracking |
Maintenance Gaps That Inflate Carbon Intensity Scores
Four maintenance-driven patterns consistently inflate carbon intensity across manufacturing plants. Each one is visible in a well-managed CMMS — and each one is correctable through structured work order execution and PM compliance. Sign Up Free to track these patterns in OxMaint and connect maintenance execution to your plant's carbon intensity scorecard.
Building a Maintenance-Integrated Carbon Intensity Scorecard
Classify Assets by Carbon Intensity Contribution
Rank plant assets by their energy intensity and emissions contribution. OxMaint's asset criticality classification supports this ranking and ensures the highest-impact assets receive priority maintenance scheduling to protect scorecard performance.
Schedule Carbon-Relevant Inspection Tasks
Configure OxMaint work orders for thermal imaging, leak detection, insulation checks, and power factor audits on high-intensity assets. Attach results to asset records to build the inspection history that sustainability audits require.
Track PM Compliance as a Scorecard Input
Report PM compliance rates by asset class and production area in OxMaint. Use compliance data as a leading indicator in your carbon intensity scorecard — connecting maintenance execution directly to emissions accountability.
Convert Scorecard Findings into Corrective Work Orders
When carbon intensity review identifies underperforming assets, OxMaint converts findings into priority corrective work orders with assigned technicians, target completion dates, and tracked outcomes — making scorecard improvement measurable.
Report Maintenance Impact on Carbon Intensity Trends
OxMaint's reporting dashboards allow maintenance managers to present PM compliance rates, corrective action closure rates, and asset condition trends as direct inputs into carbon intensity scorecard reviews — bridging the gap between maintenance and sustainability reporting.
Frequently Asked Questions: Carbon Intensity Scorecards for Manufacturing
What is a carbon intensity scorecard for manufacturing plants?
A carbon intensity scorecard tracks emissions per unit of production output across assets, lines, or cost centers. It converts plant-wide sustainability targets into asset-level performance metrics that maintenance and operations teams can act on directly.
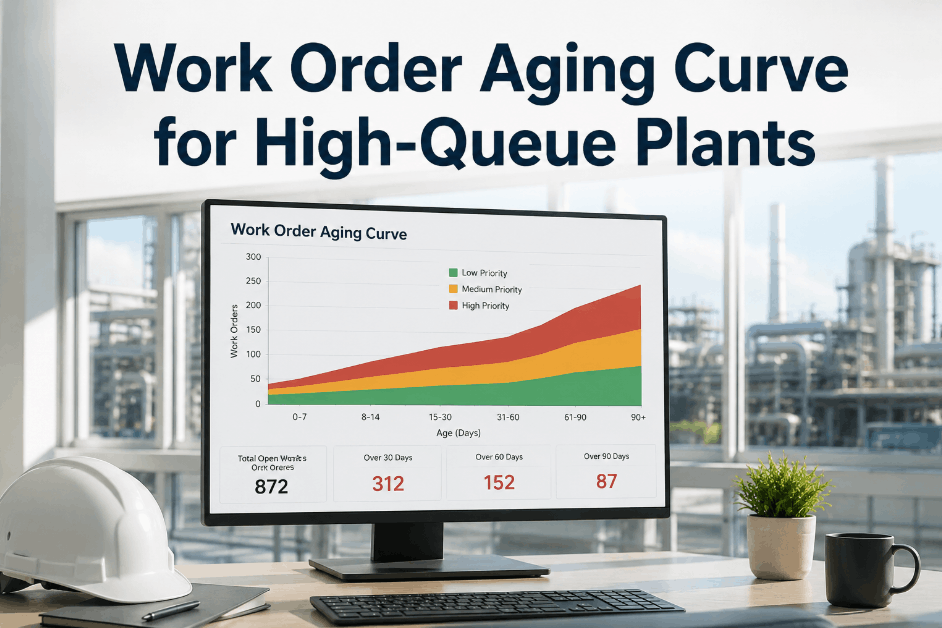
How does maintenance backlog affect carbon intensity scores?
Deferred maintenance increases energy waste on degraded assets — inflating carbon intensity without any change in production volume. OxMaint's PM compliance reporting makes this connection visible so maintenance teams can defend and improve scorecard performance.
How does OxMaint support carbon intensity scorecard reporting?
OxMaint provides asset criticality classification, inspection scheduling, PM compliance reporting, and corrective work order tracking — giving sustainability and maintenance teams the shared data layer that accurate carbon intensity scorecards require.
Which assets contribute most to carbon intensity in manufacturing plants?
Motor-driven equipment, compressed air systems, steam generation, and heat exchange assets typically account for the majority of carbon intensity variance. Regular maintenance on these asset classes delivers the highest scorecard improvement per maintenance dollar spent.
How often should carbon intensity scorecards be reviewed?
Monthly review of scorecard trends allows maintenance and sustainability teams to catch performance drift before it becomes a compliance or reporting problem. OxMaint's dashboards support this cadence without manual data collection.