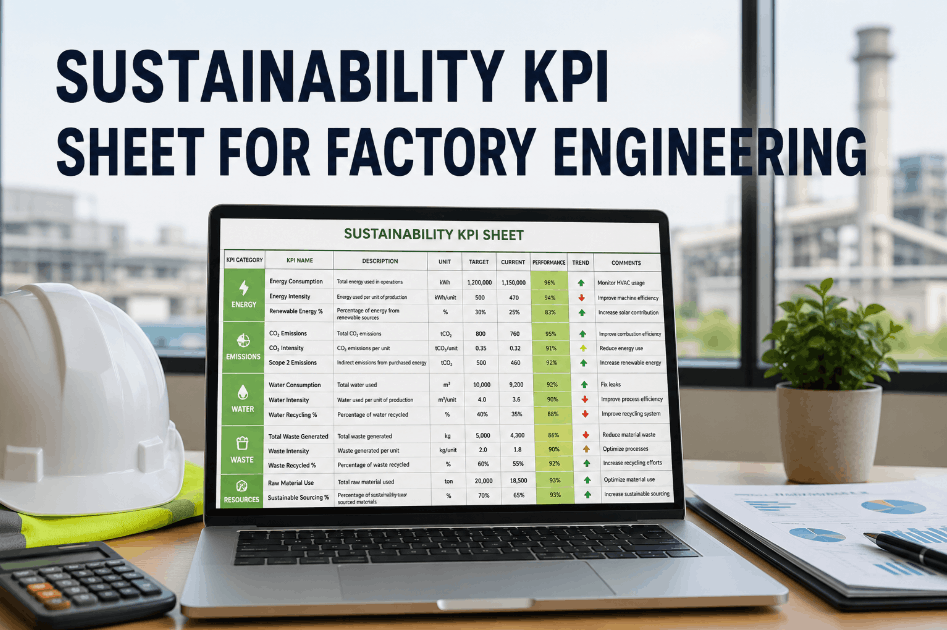
Factory engineering teams are increasingly responsible for sustainability performance, but most ESG KPI frameworks are designed for finance teams—not for the maintenance and operations staff who actually drive the numbers. A sustainability KPI sheet built for factory engineering translates carbon intensity, energy consumption, water use, and waste output into asset-level metrics that maintenance teams can act on, inspect against, and improve through scheduled work. Sign Up Free to map your facility's sustainability KPIs to asset records and inspection checklists in OxMaint—connecting engineering performance to ESG reporting without adding a separate tracking system. Without an engineering-facing KPI framework, sustainability targets become quarterly surprises rather than daily operating standards. OxMaint connects PM completions, meter readings, and inspection results to the KPI metrics that matter—so engineering leaders can see sustainability performance in the same platform they use to manage maintenance. Book a Demo to see how OxMaint structures sustainability KPIs for factory engineering teams.
Sustainability KPI Sheet for Factory Engineering
ESG targets only move when engineering teams have asset-level metrics they can act on. OxMaint connects sustainability KPIs to maintenance schedules, inspection results, and work order completions—making performance review a maintenance conversation, not just a finance one.
What a Factory Engineering Sustainability KPI Sheet Covers
A factory engineering KPI sheet translates high-level ESG targets into the operational metrics that maintenance and engineering teams can measure, track, and improve through daily work. It covers energy intensity per production unit, water consumption per process area, carbon output from utilities and refrigerants, maintenance-related waste such as lubricants and filter materials, and equipment efficiency indicators like OEE and asset availability. Each KPI has a target, a measurement method, a data source inside OxMaint, and a review frequency. Sign Up Free to start building your engineering KPI framework inside OxMaint, linked to the assets and inspection schedules that generate the underlying data. When KPIs are disconnected from the maintenance system, the data collection burden falls on engineers who are already managing reactive work. OxMaint removes this burden by generating KPI inputs automatically from PM completions, meter readings, and inspection records—so the KPI sheet is always current without manual data entry. Book a Demo to see how OxMaint generates KPI data automatically from maintenance records.
Using KPI Data for Engineering Review and ESG Reporting
The value of a sustainability KPI sheet is not the data itself—it is the conversation it enables at every engineering review meeting. When KPIs are derived from OxMaint's asset and maintenance records, every number can be traced to a specific asset, a maintenance event, or an inspection result. Declining energy intensity after a motor replacement program is not an estimate; it is a number with a work order behind it. This traceability makes engineering reviews credible and ESG submissions defensible. Book a Demo to see OxMaint's sustainability dashboard for engineering review. For factory engineering teams facing external audit requirements, OxMaint's timestamped records, asset histories, and inspection logs provide the documentation layer that auditors require. The KPI sheet becomes the front end of a documented compliance system rather than a manually assembled spreadsheet that cannot withstand scrutiny.
Connect Sustainability KPIs to Your Engineering Workflow
OxMaint links energy, water, carbon, and maintenance efficiency KPIs directly to asset records and PM schedules—so sustainability performance is visible every day, not just at quarter-end review.
Frequently Asked Questions — Sustainability KPI Sheet for Factory Engineering
Build Your Factory Engineering Sustainability KPI Sheet
OxMaint connects asset-level sustainability metrics to maintenance workflows, generates KPI data automatically, and produces the audit trail that ESG reporting requires. Free to start. Make sustainability a daily engineering standard.