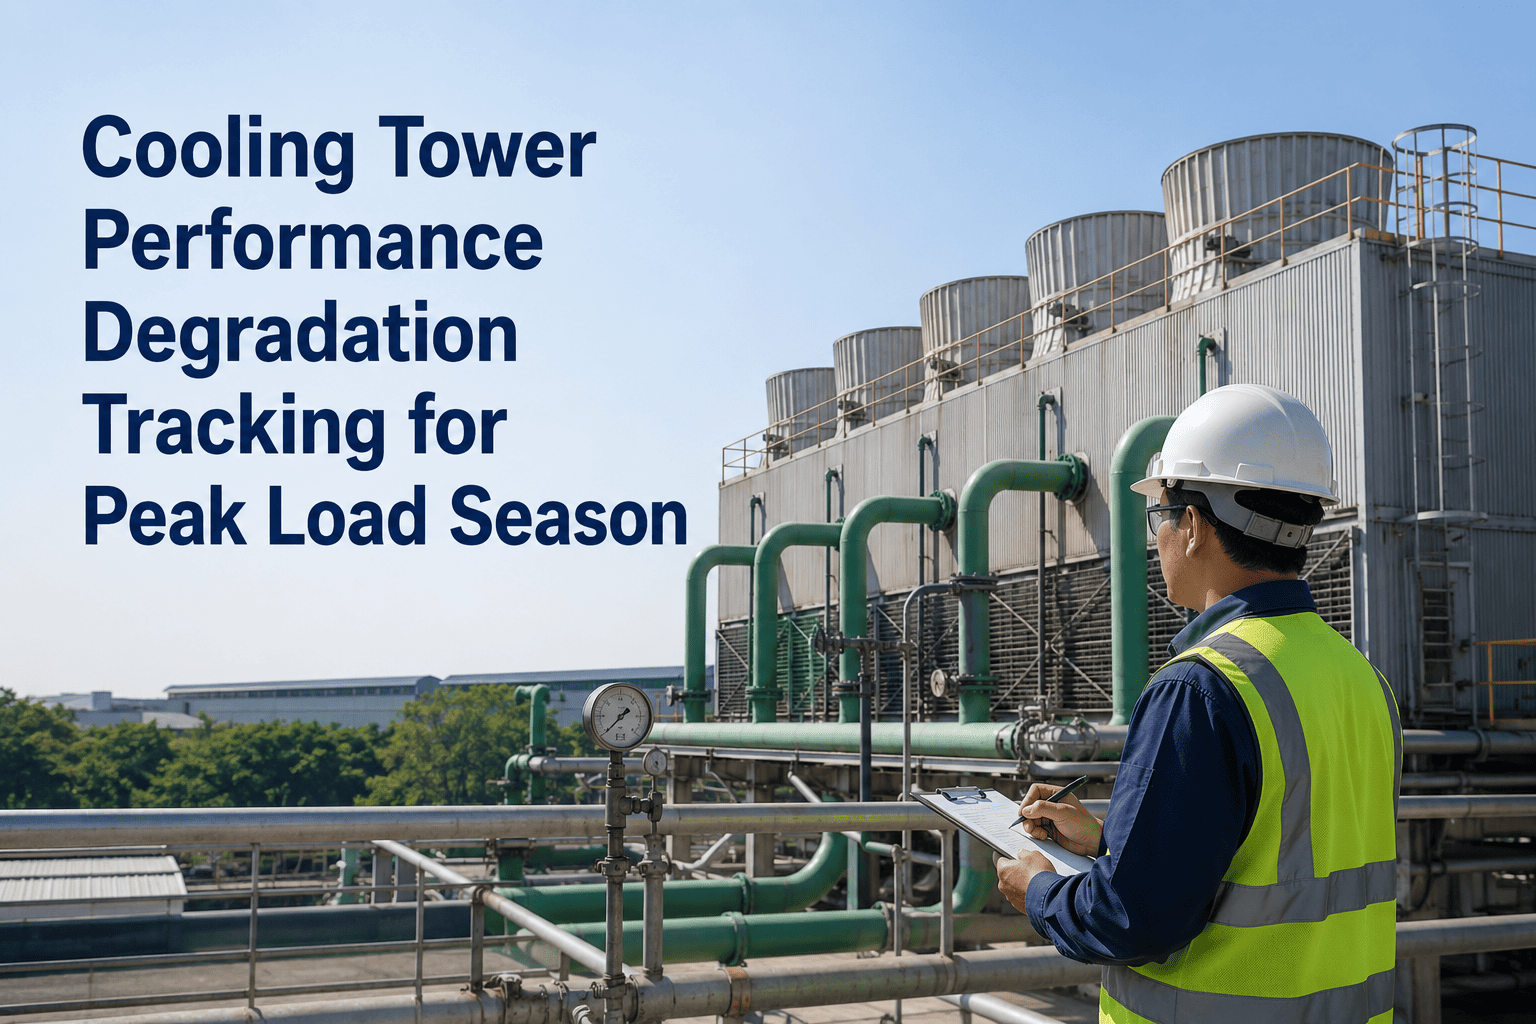
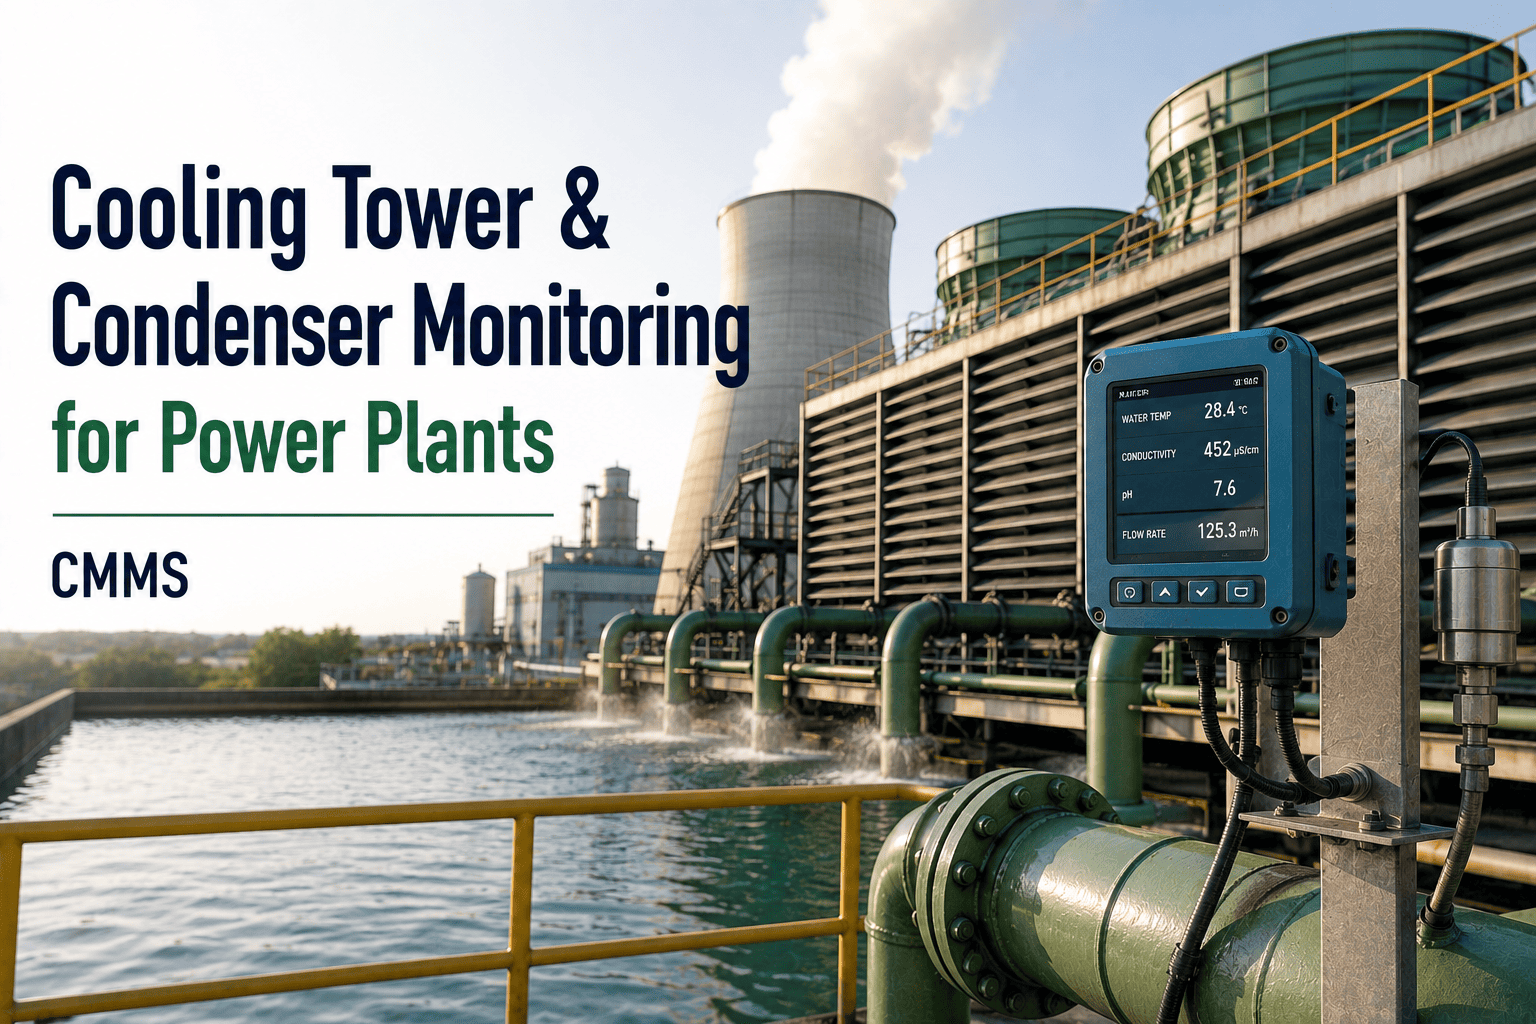
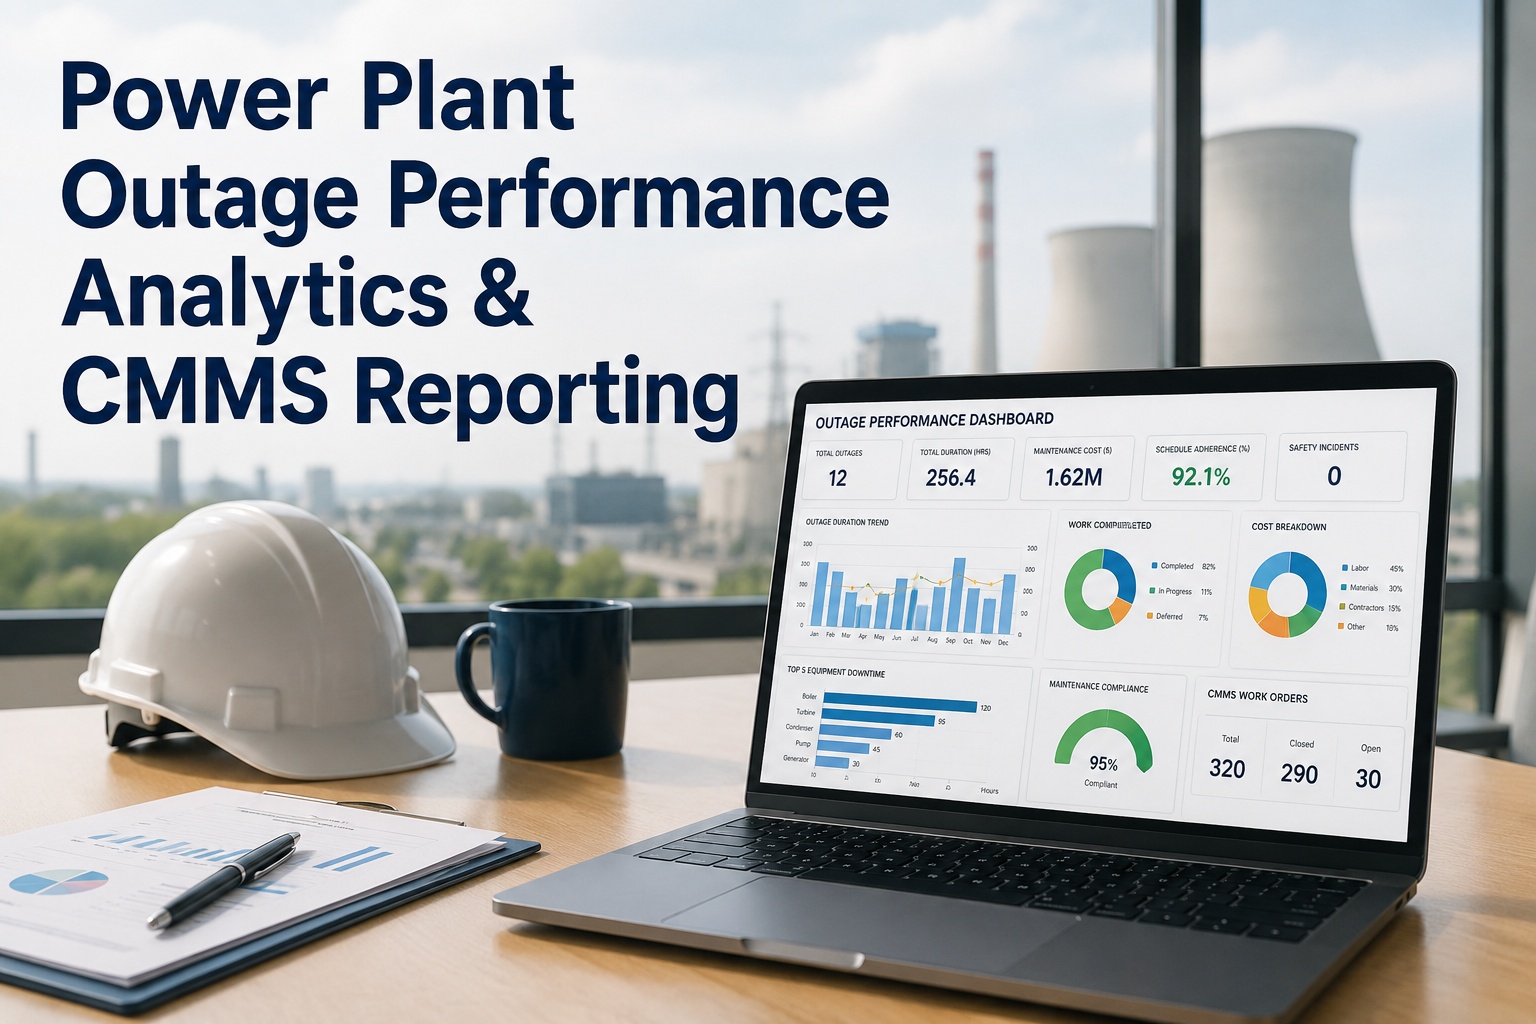
When ambient temperatures push past 35°C and grid operators call for maximum generation output, a cooling tower that is operating at 94% of design capacity instead of 100% is not a minor efficiency footnote — it is the difference between rated output and a forced derating event that can cost $120,000 to $400,000 per day in lost capacity payments. Cooling tower performance degradation during peak load season follows a predictable but often unmonitored curve: drift eliminator fouling, fill media scaling, fan blade pitch erosion, nozzle clogging, and basin sludge accumulation each impose compounding penalties on thermal rejection capacity that are individually small but collectively severe. Without analytics that trend approach temperature, Cooling Tower Effectiveness (CTE), and L/G ratio simultaneously across the season, operators are flying blind into the highest-consequence thermal window of the year. Start tracking cooling tower performance in Oxmaint free and build the analytics baseline before peak season arrives.
Cooling System Reliability
Analytics & Reporting
Peak Load Season
Cooling Tower Performance Degradation Tracking for Peak Load Season
Real-time analytics for approach temperature, Cooling Tower Effectiveness, and L/G ratio — the three KPIs that predict capacity derating before peak demand hits.
6°C
Approach temperature rise that triggers turbine derating at peak load
$400K
Daily revenue loss from cooling-limited generation during peak demand period
3–5 wks
Lead time for fill media scaling to reach performance-limiting threshold
18%
Cooling tower capacity reduction from fan blade erosion and pitch drift alone
82%
Of cooling-related derating events are preceded by trackable performance trends
60 days
Typical window from first measurable drift to actionable performance loss
Why Tracking Fails
The Gaps That Let Cooling Tower Degradation Become a Derating Event
Most power plants track cooling tower outlet temperature. Very few track the metrics that predict when that temperature will start causing problems — until it already has. These are the four gaps that turn a gradual performance curve into a peak-day crisis.
01
Approach Temperature Not Trended Seasonally
Approach temperature (hot water temperature minus ambient wet bulb) is the single best indicator of cooling tower condition — but most plants only check it reactively. Without seasonal trending, a 2°C per-month degradation curve is invisible until it becomes a 6°C peak-day problem.
02
No Fill Media Degradation Analytics
Fill media scaling, biofouling, and deformation each reduce thermal surface area. The degradation is gradual — 1–3% per month in hard water areas — and invisible without pressure drop trending across the fill depth. By the time it is visible on a quarterly inspection, the performance loss is already compounding.
03
Fan System Performance Not Baselined
Fan blade pitch erosion, belt slip, and motor efficiency drift each reduce airflow below design. A 10% airflow reduction causes a 6–8% increase in approach temperature at peak load — but without a fan performance baseline in the CMMS, maintenance teams have no reference point to detect the drift until it becomes symptomatic.
04
Water Chemistry Events Not Linked to Maintenance
A Langelier Saturation Index excursion above +0.5 starts scaling the fill within 48 hours. But water chemistry data rarely lives in the same system as maintenance work orders — so a scaling event triggers a chemistry note, not a cleaning work order, and the fill continues degrading through peak season.
The Three KPIs
Cooling Tower Analytics That Predict Peak Season Capacity — Not Just Monitor It
Oxmaint's analytics module tracks three performance KPIs simultaneously, trending each against seasonal baseline and alerting when trajectory indicates a peak-season problem 30–60 days in advance.
Approach Temperature
Hot Water Temp − Ambient Wet Bulb
Target: < 3°C at design load | Alert: > 5°C trend
The primary thermal performance indicator. Oxmaint trends this hourly, corrects for ambient wet bulb, and projects the 30-day trajectory against the peak load forecast window. If the corrected approach temperature is trending toward 6°C before peak week, a maintenance work order is generated immediately — not after peak day.
Predicted by Analytics
Cooling Tower Effectiveness (CTE)
(Hot Water Temp − Cold Water Temp) ÷ (Hot Water Temp − Ambient WB)
Target: 70–85% | Alert: < 65% declining trend
CTE captures fill media condition and water distribution efficiency in a single ratio. A declining CTE at constant load indicates fill fouling or nozzle clogging — not ambient conditions. Oxmaint distinguishes degradation-driven CTE drops from weather-driven variation, so maintenance is triggered by real performance loss only.
Fill Media Indicator
L/G Ratio
Liquid Flow Rate ÷ Air Mass Flow Rate
Target: 0.75–1.5 | Alert: deviation > 15% from baseline
L/G ratio directly measures the balance between water and airflow that determines heat rejection efficiency. Fan blade erosion and motor degradation shift L/G upward; nozzle clogging shifts it asymmetrically across cells. Oxmaint tracks L/G per cell and flags asymmetry — catching single-cell problems before they become system-level degradation.
Fan System Indicator
Track approach temperature, CTE, and L/G ratio before peak load season — not during it
Oxmaint's analytics module builds the seasonal baseline automatically, alerts on degradation trajectories 30–60 days ahead, and generates maintenance work orders tied directly to the performance data.
Degradation Components
The Six Components That Degrade — and What Each Costs at Peak Load
Cooling tower performance degradation is never from a single source. The table below maps each degradation mechanism, its detection signal in Oxmaint analytics, and its contribution to peak-season capacity loss if not addressed before peak load arrives.
| Component |
Degradation Mechanism |
Oxmaint Analytics Signal |
Peak Load Penalty |
Intervention Window |
| Fill Media |
Scaling, biofouling, deformation |
CTE declining > 3% month-over-month |
4–9% capacity loss |
Replace or chemically clean at 4–6 weeks before peak |
| Fan Blades |
Pitch erosion, imbalance, tip damage |
L/G ratio rising; vibration amplitude trending up |
6–18% airflow loss |
Pitch adjustment or blade replacement before peak season |
| Nozzles & Distribution |
Scale plugging, wear, misalignment |
Asymmetric approach temperature across cells |
3–7% effectiveness loss |
Cleaning or replacement during pre-peak outage window |
| Drift Eliminators |
Fouling, warping, pack collapse |
Basin makeup water consumption rising above baseline |
Water loss + airflow restriction |
Inspect and replace in scheduled maintenance window |
| Basin & Sump |
Sludge accumulation, biological growth |
Water chemistry LSI trending up; pump cavitation events |
Pump head loss; fill pre-fouling |
Clean 6–8 weeks before peak season entry |
| Fan Motors & Gearboxes |
Efficiency drift, bearing wear, oil breakdown |
Motor current rising; vibration on gearbox bearings |
Fan speed reduction; failure risk |
Oil change and bearing check at seasonal PM milestone |
Scroll horizontally on mobile to view all columns
Analytics Dashboard
What the Oxmaint Cooling Tower Analytics Dashboard Shows Operations Managers
The dashboard is designed around one question: will this cooling tower meet design capacity on the hottest day of the peak load season? Every metric is oriented around that answer — not just historical data.
Seasonal Approach Temperature Trend
Approach temperature trending toward alert threshold entering June — fill media inspection work order auto-generated for May 20
CTE by Cell
Cell 1
78%
On Target
Cell 2
76%
On Target
Cell 3
64%
Declining
Cell 4
80%
On Target
Peak Season Readiness Score
74
/ 100
3 items need attention before peak load window
Cell 3 fill media — schedule cleaning
Fan 2 blade pitch — check erosion
Basin sludge — schedule pre-season clean
FAQ
Frequently Asked Questions on Cooling Tower Performance Analytics
What is the best single indicator of cooling tower performance degradation?
Approach temperature corrected for ambient wet bulb is the most reliable single indicator because it isolates thermal performance from weather variation. A rising corrected approach temperature over 4–6 weeks definitively indicates internal degradation — fill fouling, nozzle blockage, or airflow reduction — not ambient conditions.
Oxmaint's analytics dashboard trends corrected approach temperature automatically and alerts when the 30-day trajectory points toward a peak-season problem.
How far in advance can analytics predict a peak-season derating event?
Most cooling-related derating events are preceded by 45–90 days of trackable performance trends. Fill media degradation and fan system drift develop over weeks — not hours. Starting analytics tracking in March for a July peak window gives 90–120 days of trend data, which is more than enough lead time to schedule and complete every required intervention before peak load arrives.
Book a demo to see the seasonal baseline setup process in Oxmaint.
Can Oxmaint analytics differentiate between fill fouling and fan system problems?
Yes. Fill fouling primarily degrades CTE while L/G ratio remains stable. Fan system problems increase L/G ratio (less air per unit water) while CTE may remain temporarily stable. Tracking both simultaneously in Oxmaint allows the analytics to fingerprint the degradation source — so maintenance targets the correct component rather than performing a full cleaning when a fan pitch adjustment would have been sufficient.
What data sources does Oxmaint need to run cooling tower performance analytics?
The minimum required inputs are hot water inlet temperature, cold water outlet temperature, ambient wet bulb temperature, and fan motor current (as an airflow proxy). Full analytics also benefit from individual cell flow rates and water chemistry LSI readings. Most plants have all of these in their DCS — Oxmaint connects via OPC-UA or Modbus without requiring new instrumentation for basic performance trending.
How does peak load season analytics differ from standard cooling tower monitoring?
Standard monitoring tells you what is happening now. Peak season analytics tells you what will happen on your highest-consequence day 30–60 days from now. The difference is trajectory modelling — Oxmaint projects each KPI forward against peak load conditions and flags which components need intervention before that window, not after it.
Start tracking your cooling tower baseline in Oxmaint today.
Know your cooling tower's peak-season capacity score 60 days before peak load arrives
Oxmaint tracks approach temperature, CTE, and L/G ratio in real time — projecting performance trajectories against your peak demand window and generating work orders for every component that needs attention before the hottest days of the year.