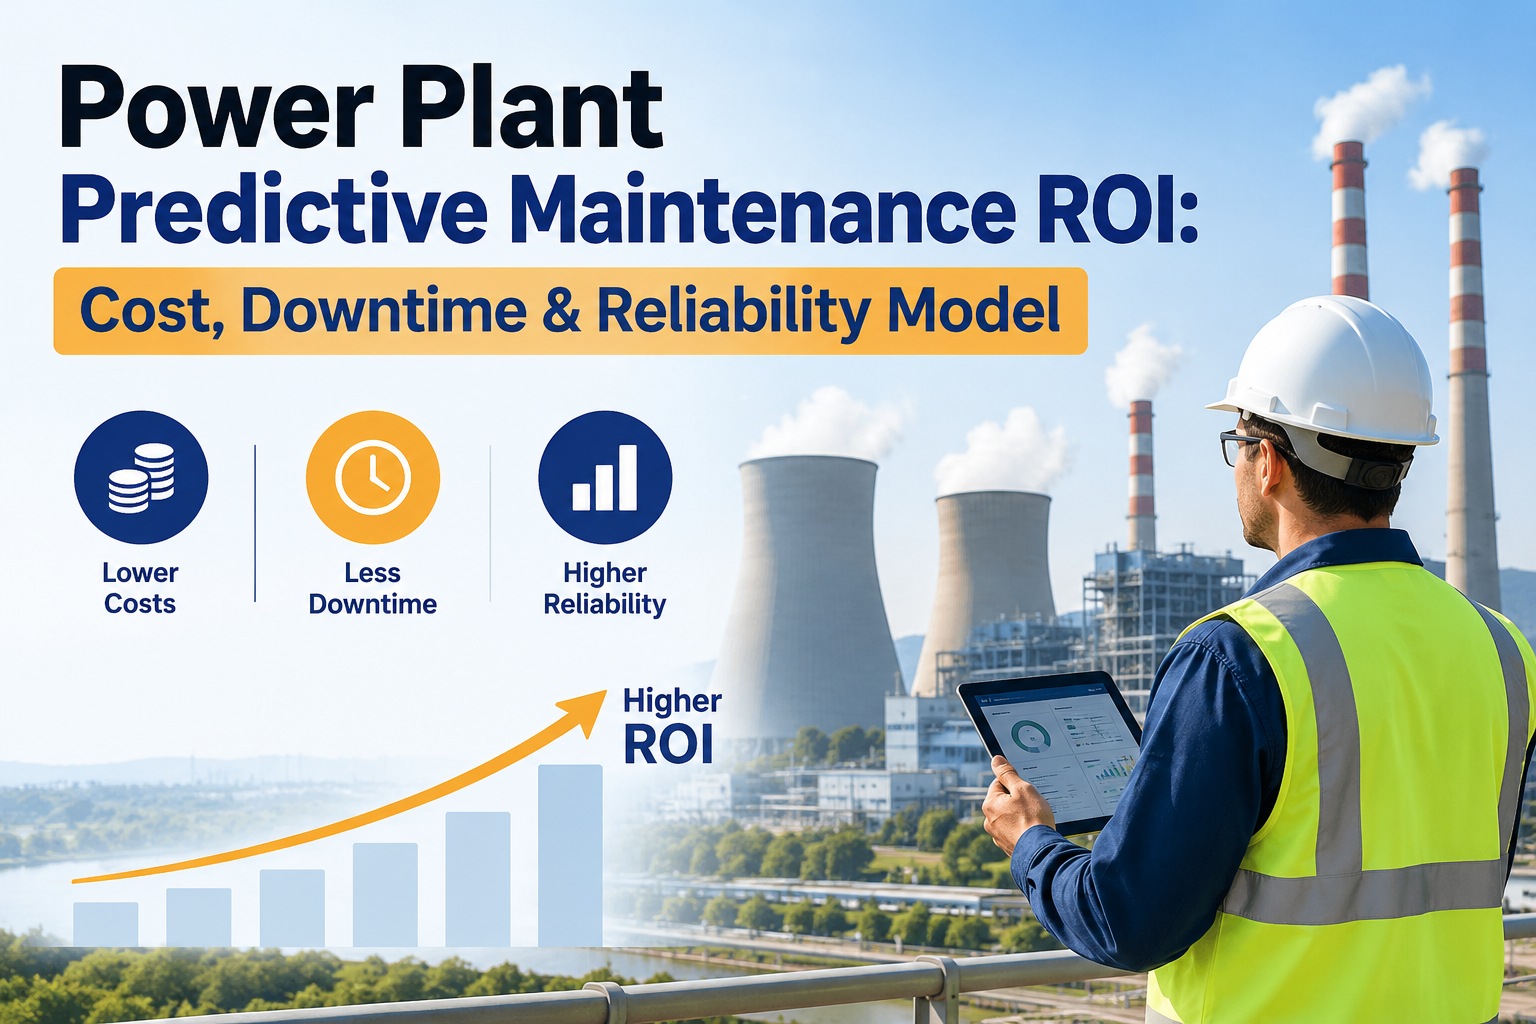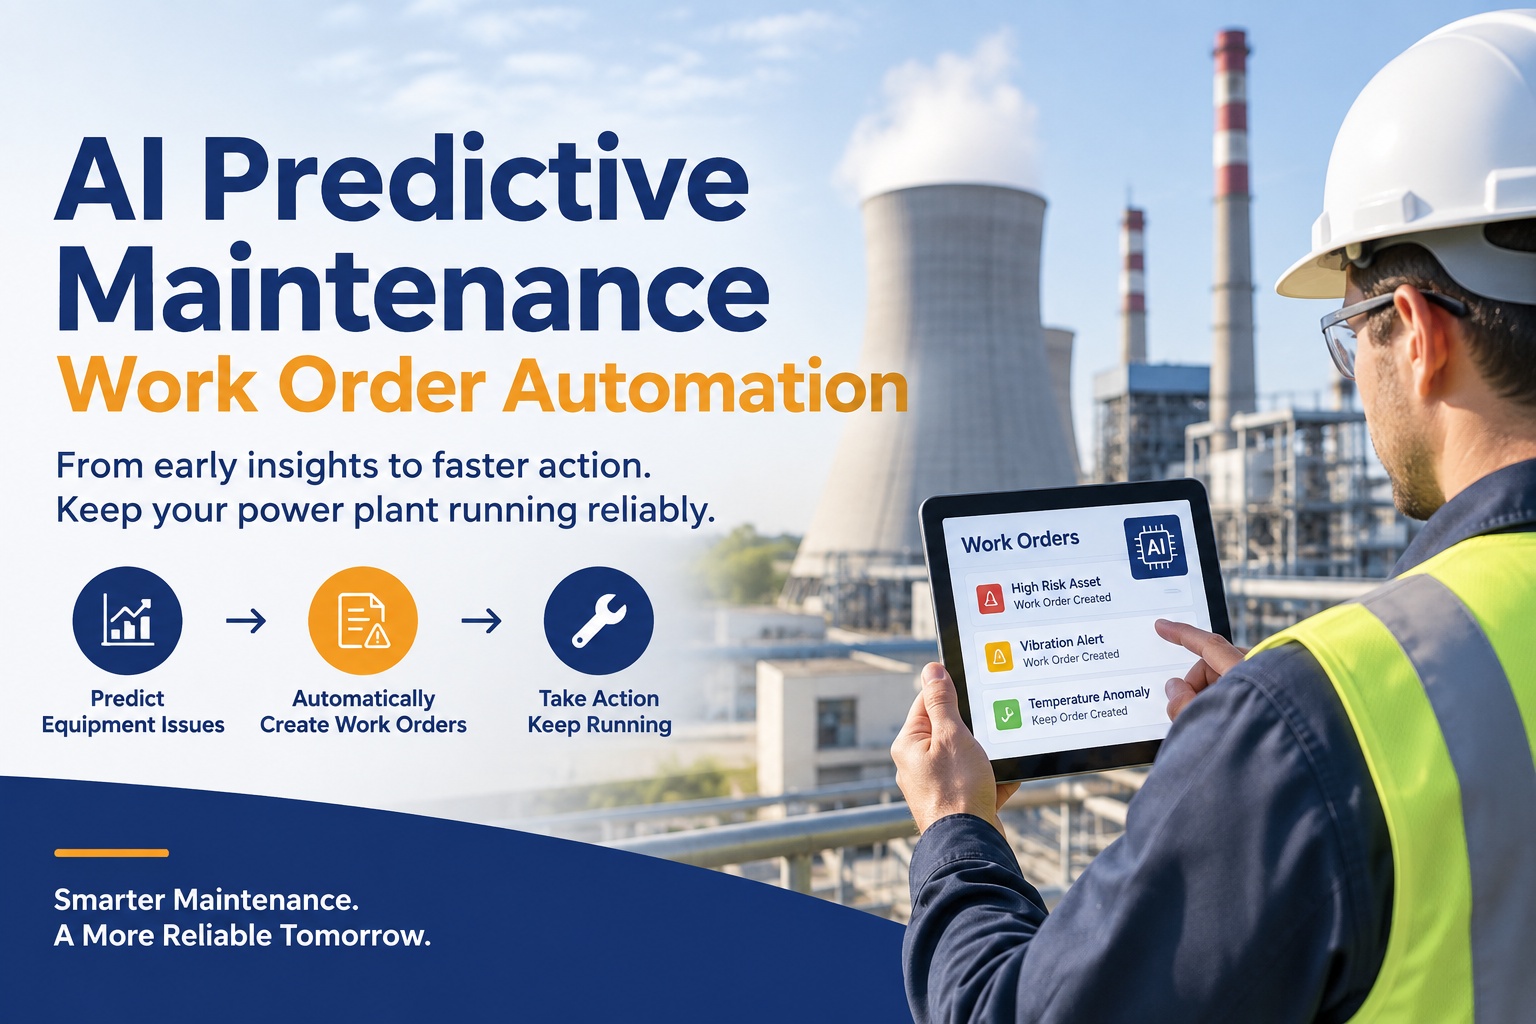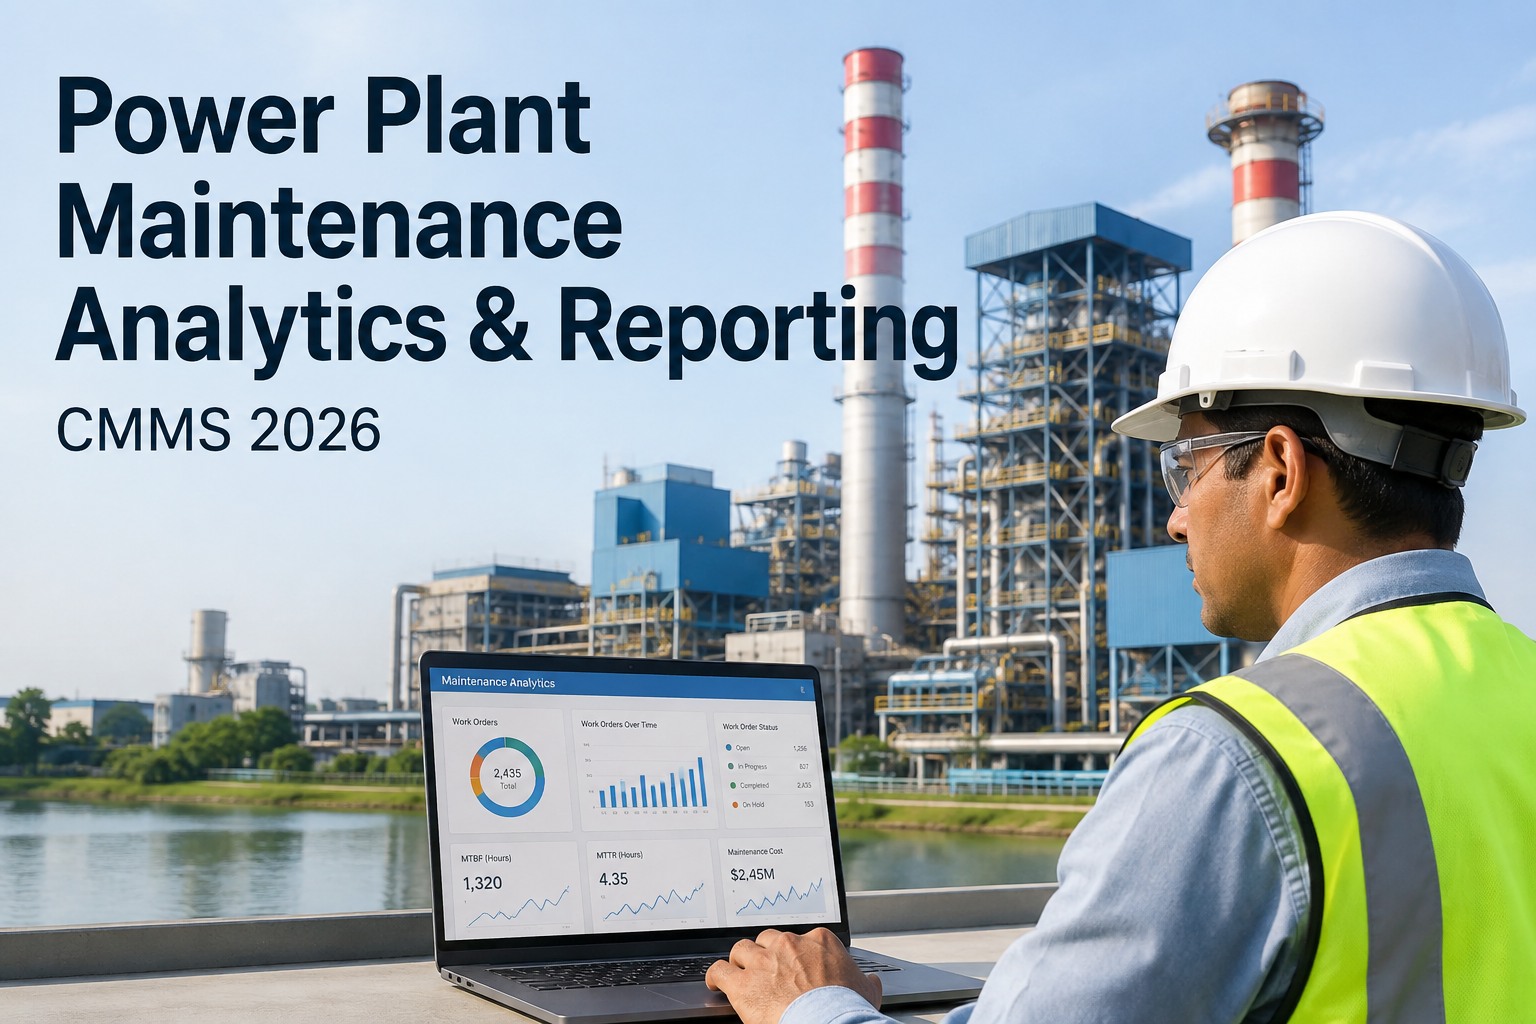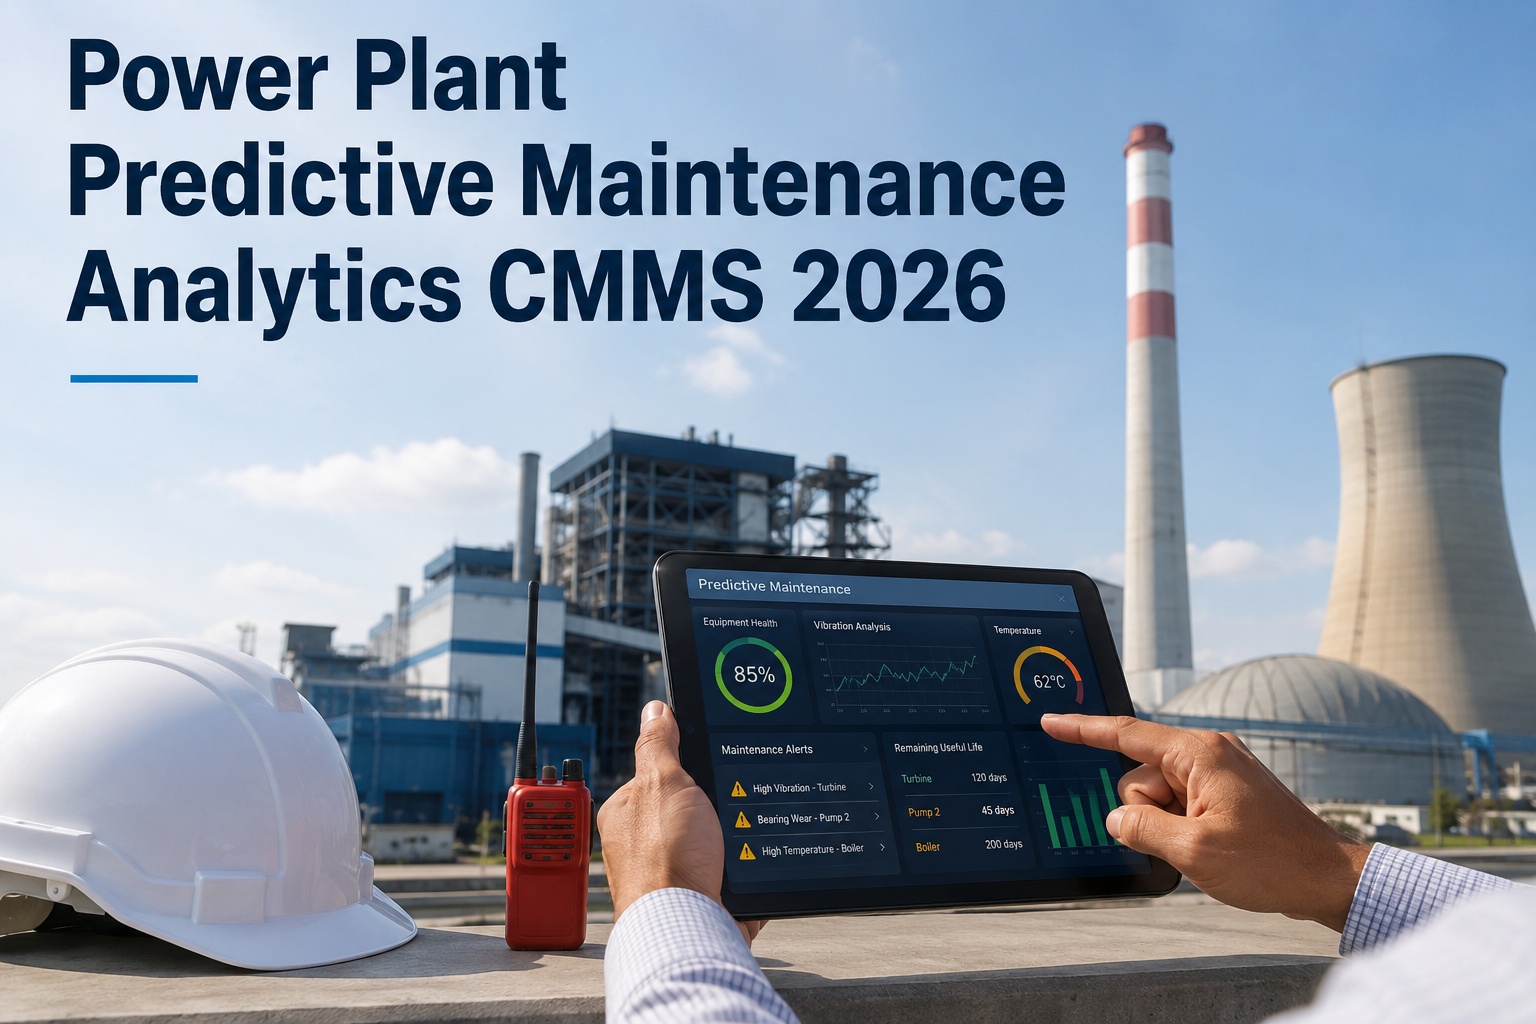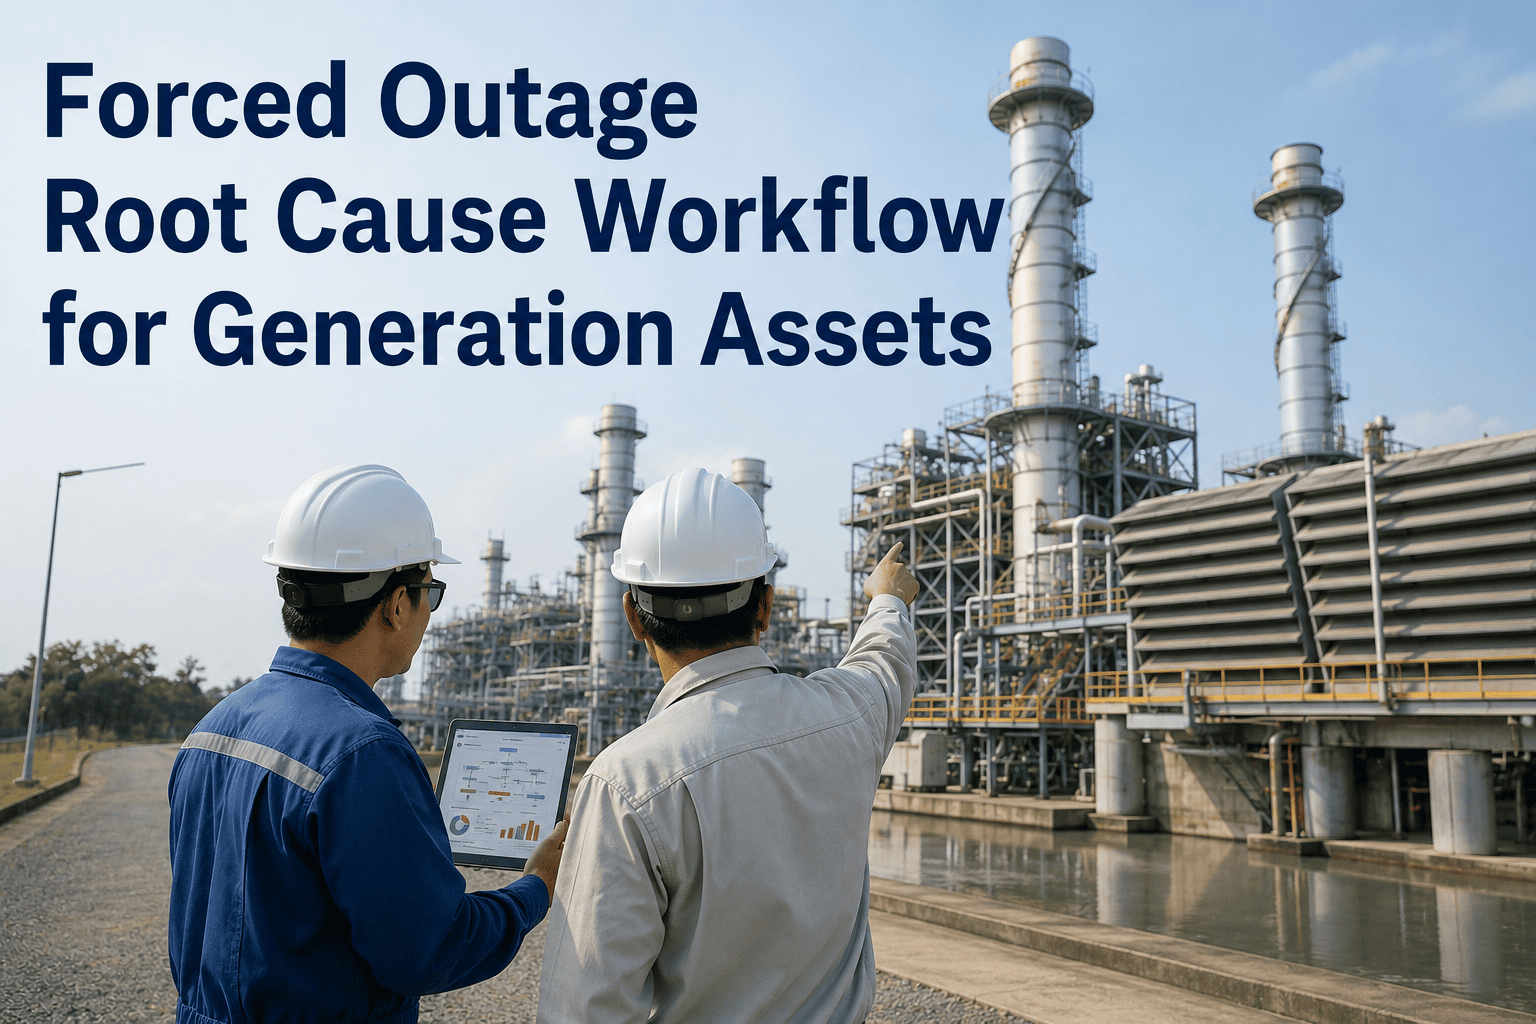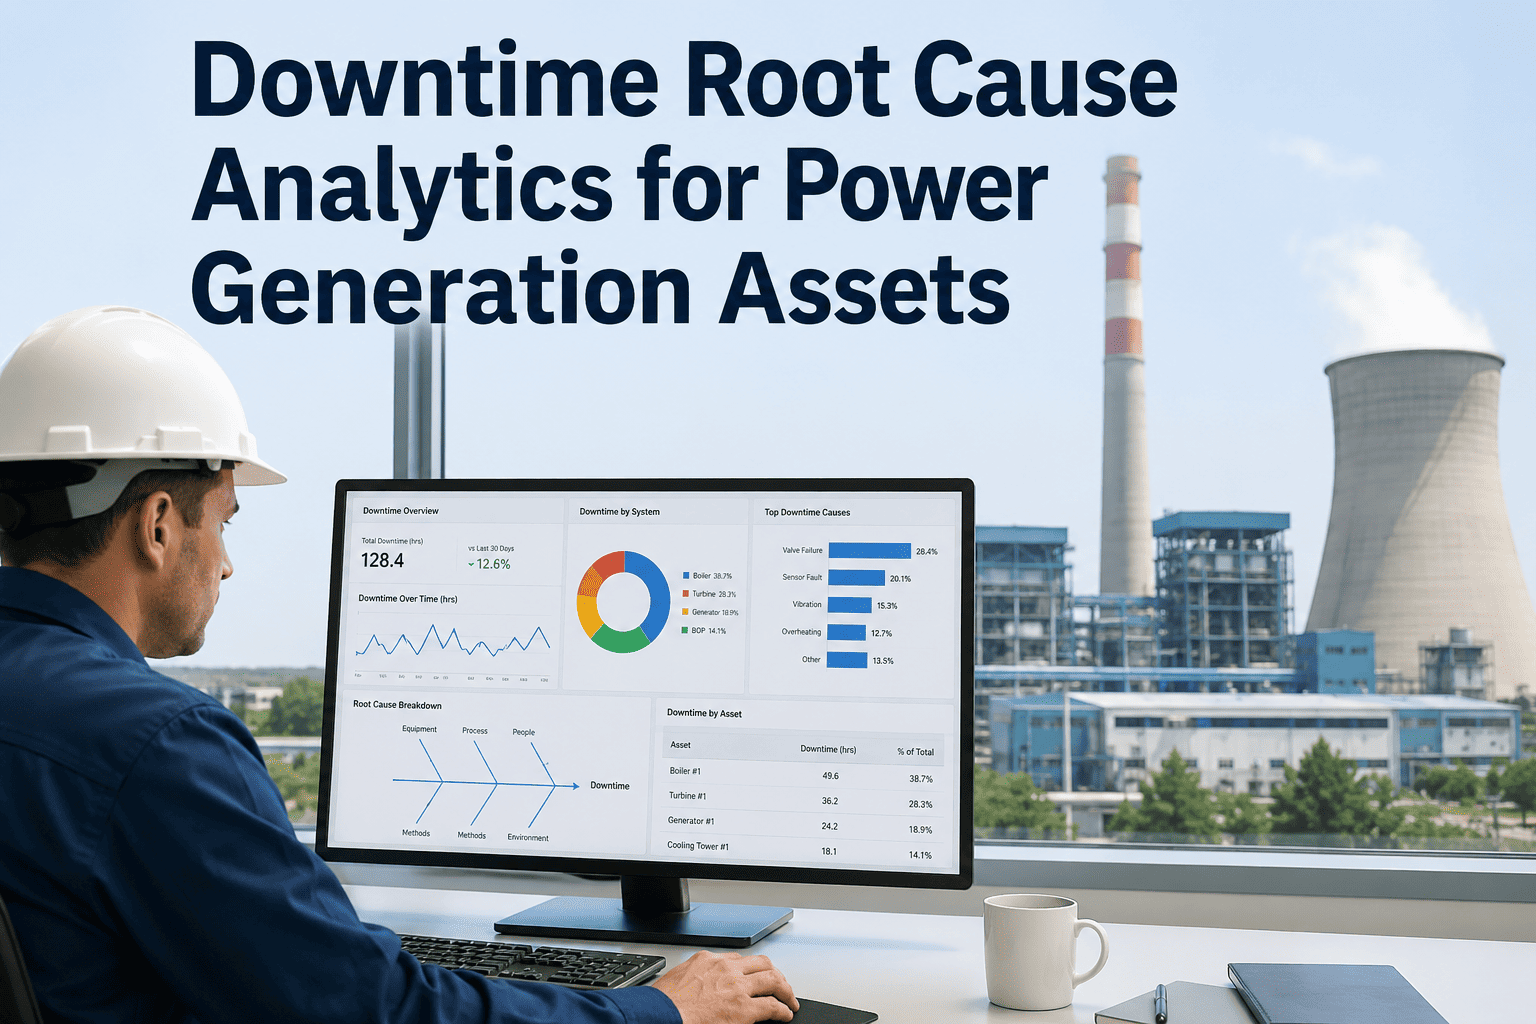
Every unplanned outage in a power generation facility costs money in ways that compound quickly: lost generation revenue, emergency repair labor, expedited parts, regulatory reporting obligations, and — for grid-critical facilities — potential reliability standard violations. The numbers vary by fuel type and capacity factor, but industry figures consistently place the cost of unplanned downtime for thermal and combined-cycle assets between $10,000 and $100,000 per hour depending on capacity and market position. What makes that figure genuinely painful is that most of these failures were not random — they followed a pattern, and the pattern was in the data before the failure occurred. Downtime root cause analytics connects failure events to the maintenance, inspection, and operational records that preceded them, making the pattern visible after the first occurrence so it cannot cause a second. Explore how OxMaint Analytics and Reporting enables this, or book a demo with our power generation team.
What Unplanned Downtime Actually Costs Power Plants
The direct cost of unplanned downtime in power generation is significant. The indirect costs — regulatory, reputational, and reliability-standard related — can exceed them.
Root Cause Analytics: How It Works in Power Generation
Root cause analytics in a maintenance context is not post-incident investigation — it is a continuous analytical process that connects failure data to contributing factors in near real time, enabling pattern recognition before the next failure occurs.
The Five Root Cause Families in Power Generation
The single largest preventable failure cause. Analytics identifies which asset failures were preceded by one or more missed PMs within the failure's contributing window — typically 30 to 90 days — quantifying the true cost of deferred maintenance for leadership.
Components replaced on a fixed interval that have worn beyond tolerance before the interval ends — indicating the interval needs to be tightened or the operating condition has changed. Analytics surfaces these by comparing part replacement records to failure events.
A failure that follows a recent maintenance event — typically within 30 days — where the prior work order reveals a mis-specification, a skipped step, or an incorrect part. Analytics flags these re-failure patterns and links them to the originating work order and technician.
When the same failure mode appears across multiple units of the same asset model, the root cause is likely a design or specification issue rather than an individual maintenance failure. Analytics identifies these fleet-wide patterns that individual plant teams cannot see in isolation.
Failures that correlate with operating conditions — high ambient temperature, load cycling frequency, fuel quality variation — rather than maintenance gaps. Analytics separates these from maintenance-attributable failures to ensure corrective action is targeted at the right cause.
OxMaint Analytics connects each failure event to its contributing factors automatically — turning your work order and inspection history into a root cause knowledge base that prevents the next failure before it starts.
What Root Cause Analytics Changes in the Plant
A turbine trips. The team investigates, replaces the failed component, and closes the work order. The same turbine — or its identical twin on Unit 2 — fails for the same reason eleven months later.
The failure is coded and its contributing factors are logged. Analytics identifies it as a repeat-cause event and flags Unit 2 for inspection. PM intervals for both units are adjusted. The Unit 2 failure does not happen.
Leadership asks how much the deferred maintenance backlog is costing in failures. No one has an answer because work orders are not linked to failure events in any structured way.
The system produces a cost attribution report showing what percentage of failure events were preceded by a missed PM, the total downtime cost associated with deferred-maintenance failures, and which asset classes carry the highest risk per deferred PM.
A pattern of cooling tower pump failures is attributed to bad luck and aging equipment. Replacement budget is approved for early asset retirement.
Analytics identifies that all six failures were preceded by operating temperature exceedances outside the design spec. The root cause is an operating condition change, not a maintenance failure. Asset replacement is avoided; operating procedure is updated.
Frequently Asked Questions
Does root cause analytics require integration with our SCADA or DCS system?
No — OxMaint root cause analytics draws primarily from the work order, inspection, and PM completion data already in the CMMS. This alone covers the majority of maintenance-attributable failure causes, including deferred PM, incorrect repair, and wear-interval issues. SCADA and DCS integration, where available, adds operating condition data that enables the analytics to distinguish maintenance causes from process or operating condition causes. Plants typically start with maintenance-data analytics and add SCADA integration as a second phase once the core analytics are operational. Start free to explore integration options.
How does the system identify repeat failure patterns versus independent events?
The analytics engine compares failure code, asset class, asset model, and contributing factor chain across all failure events in the database. When two or more events share the same failure code category, the same asset model, and a similar contributing factor pattern — such as a missed PM within a 60-day window — they are flagged as potentially related and surfaced for review. The plant team confirms or dismisses the pattern match, which trains the system's pattern recognition over time. This is not fully automated pattern matching — human confirmation keeps false positives from triggering unnecessary corrective actions. Book a demo to see pattern matching in action.
Can the analytics distinguish between a maintenance failure and an operations failure as the root cause?
Yes — this is one of the most valuable distinctions the system makes, and it has significant organizational implications. When a failure is coded and its contributing factors are logged, the analytics separates failures with maintenance-record antecedents (missed PMs, recent incorrect repairs, overdue inspections) from failures where the maintenance record was clean and the contributing factors point to an operating condition exceedance, a process change, or a design issue. This prevents maintenance teams from absorbing accountability for failures that originate in operations decisions, and ensures corrective actions are directed at the right function.
What does a root cause analytics report look like, and who uses it?
OxMaint produces root cause analytics reports at three levels: a technical detail report for maintenance planners and reliability engineers showing failure codes, contributing factors, and recommended corrective actions; a trend summary for plant managers showing failure frequency by cause category, cost attribution, and repeat-event status; and an executive summary for plant leadership showing the financial impact of different failure cause categories, the return on deferred-maintenance correction, and reliability trend direction. Each report level is configurable by frequency and distribution, and can be exported for board reporting, insurance reviews, or NERC audit files. Start free to configure report levels.
How much historical data does the system need before root cause analytics delivers meaningful output?
For plants migrating existing work order history into OxMaint, meaningful pattern analysis is typically available from day one if at least 12 months of failure and PM records are imported. For plants starting fresh, the analytics become progressively more valuable as failure events accumulate — basic cause categorization is available immediately for each new failure event, while cross-asset pattern recognition strengthens after six to twelve months of consistent failure coding. The most impactful early output is not pattern analysis but cost attribution — showing leadership what deferred-maintenance failures have already cost in the current period, which is calculable from the first batch of historical data.
Turn Every Failure Into the Last of Its Kind
OxMaint Analytics connects each failure to its root cause, identifies repeat patterns before they recur, and quantifies what deferred maintenance is actually costing your plant — so reliability engineering stops being reactive and starts being decisive.