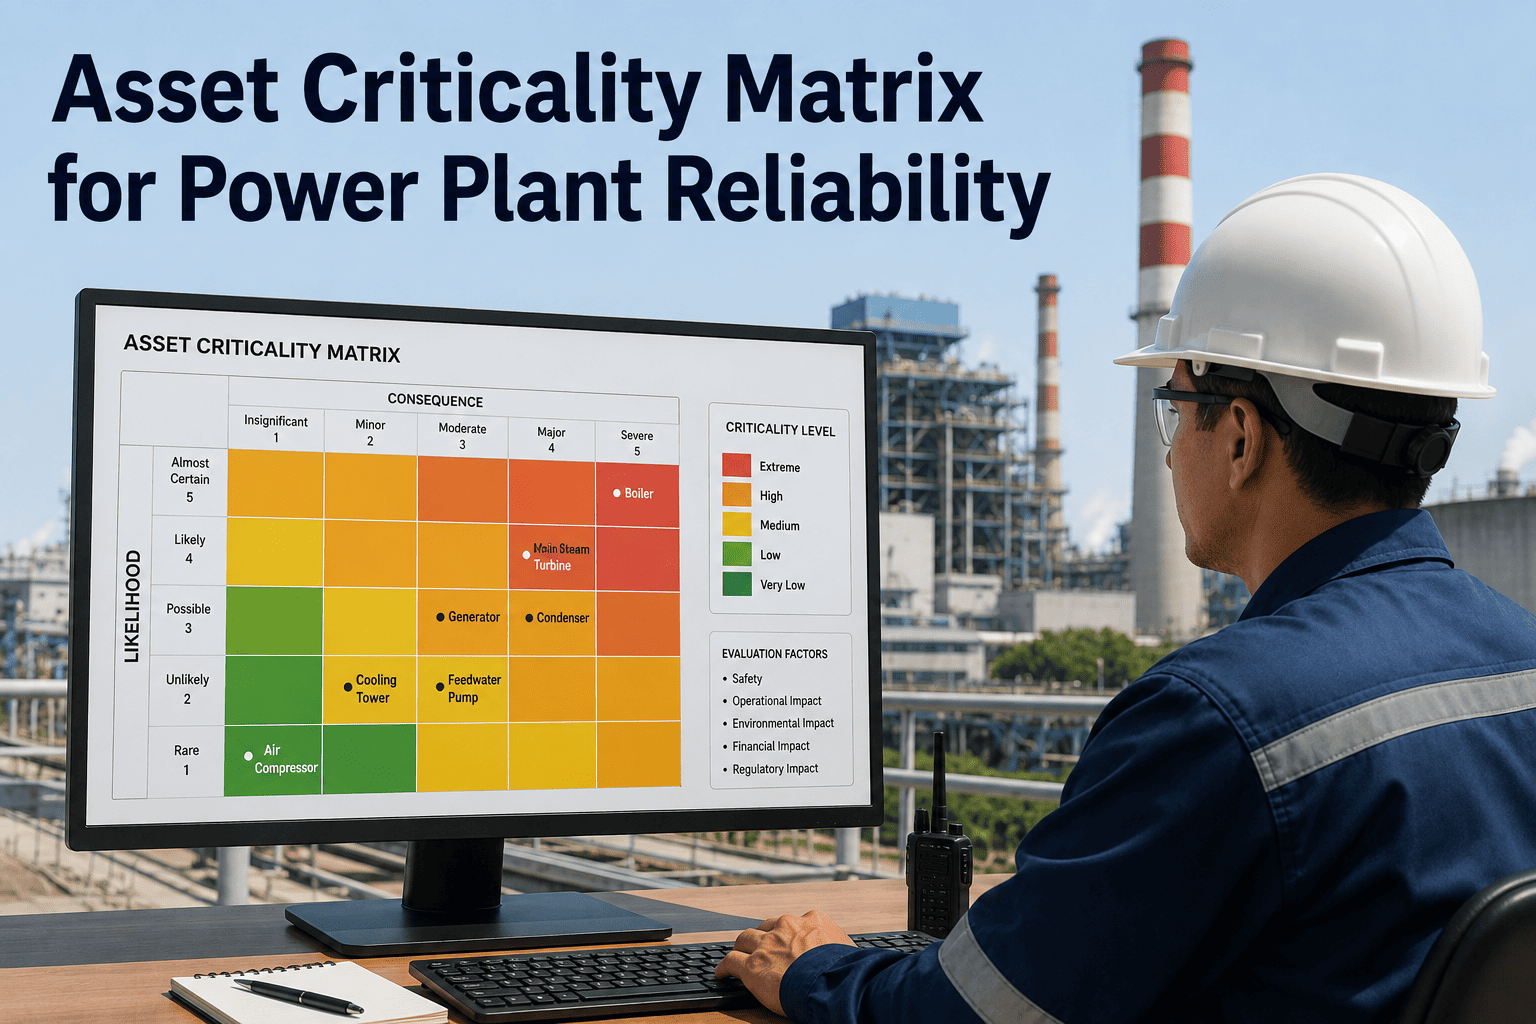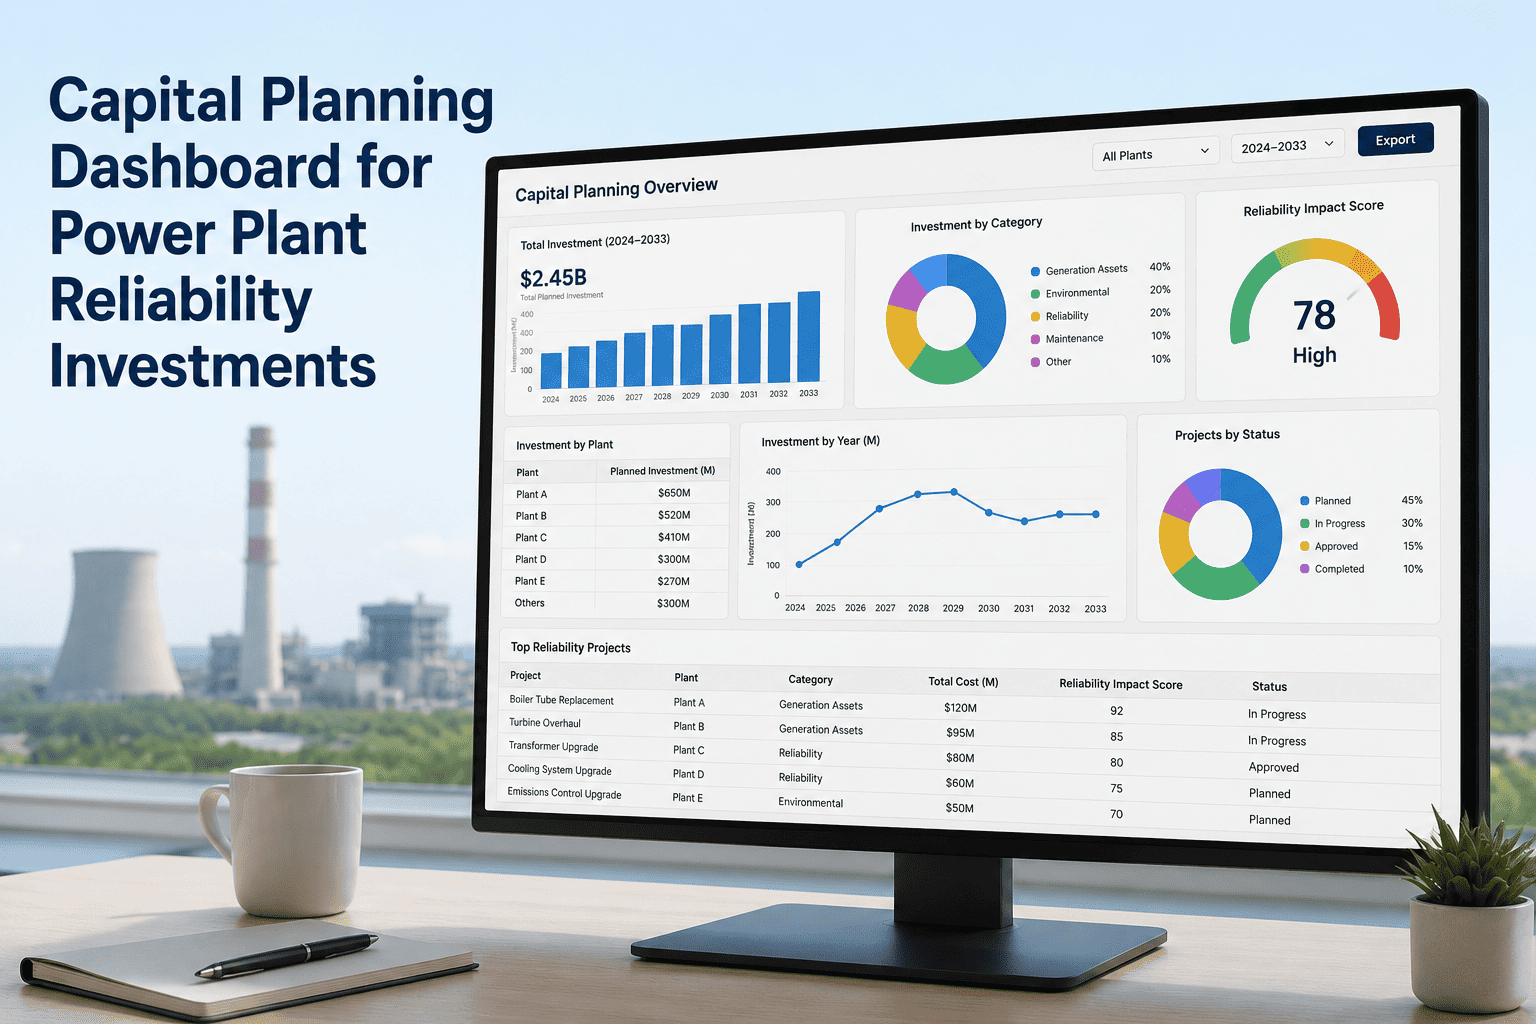
Every power plant maintenance team faces the same Monday morning problem: forty open work orders, three technicians, and no agreed way to decide what gets fixed first. A cracked valve gland and a drifting bearing temperature both look "important" on paper, but only one of them is twelve hours from a forced outage. A priority matrix solves this by scoring every repair on probability of failure against consequence of failure, then routing the highest-risk items to the front of the queue automatically. Build your plant's priority matrix in OxMaint or book a live demo to see automated risk-based dispatch in action.
Priority Matrix Inspection Checklist
This checklist provides a structured component-by-component assessment protocol covering 25 inspection items across five risk-scoring zones. Each item is a single observable or measurable condition with a priority rating based on failure probability and consequence. Complete it at every scheduled PM visit and as a walkdown observation between visits. For digital completion with automatic work order routing, deploy via OxMaint's zone-based inspection module. Book a demo to see how OxMaint converts this checklist into live digital work orders.
Checklist Scope and Usage
This checklist covers five zones: Probability Assessment, Consequence Assessment, Priority Matrix Scoring, Approval and Routing, and Review and Escalation.
Critical items have a short window to generation loss or safety incident.
Monitor items require a work order and defined re-inspection.
Routine items are documented and trended.
All FLAG findings require photo documentation before the work order is raised.
Zone 1 — Probability Assessment
Probability measures how likely a failure is to occur in the near term. Use historical data, condition monitoring, and operator logs to score each asset. Update probability scores quarterly or after any major operating change.
| Item | Frequency | Priority | Status |
|---|---|---|---|
| Failure history — number of similar failures in past 12 months | Monthly | Critical | ☐ Pass ☐ Flag |
| Condition monitoring trend — vibration, temperature, or oil analysis | Weekly | Critical | ☐ Pass ☐ Flag |
| Operator-reported anomalies or near-misses | Daily | Monitor | ☐ Pass ☐ Flag |
| Time since last overhaul or major component replacement | Quarterly | Routine | ☐ Pass ☐ Flag |
| Environmental factors — season, load profile, or startup cycles | Quarterly | Monitor | ☐ Pass ☐ Flag |
Zone 2 — Consequence Assessment
Consequence measures the severity of impact if failure occurs — covering safety, generation loss, regulatory exposure, and repair cost. Consequence ratings rarely shift; review annually or after a major incident.
| Item | Frequency | Priority | Status |
|---|---|---|---|
| Safety impact — risk of injury or fatality | Monthly | Critical | ☐ Pass ☐ Flag |
| Generation loss — MW derate or forced outage risk | Monthly | Critical | ☐ Pass ☐ Flag |
| Regulatory or environmental violation exposure | Monthly | Monitor | ☐ Pass ☐ Flag |
| Repair cost and replacement lead time | Quarterly | Routine | ☐ Pass ☐ Flag |
| Reputation or customer impact | Quarterly | Routine | ☐ Pass ☐ Flag |
Zone 3 — Priority Matrix Scoring
Plot probability against consequence on the 5x5 grid to assign a P1–P4 tier. Every work order must be scored using the same matrix — no exceptions.
| Item | Frequency | Priority | Status |
|---|---|---|---|
| Probability score assigned (1–5) | Per work order | Critical | ☐ Pass ☐ Flag |
| Consequence score assigned (1–5) | Per work order | Critical | ☐ Pass ☐ Flag |
| Matrix intersection verified against grid | Per work order | Critical | ☐ Pass ☐ Flag |
| Priority tier (P1–P4) assigned correctly | Per work order | Critical | ☐ Pass ☐ Flag |
Zone 4 — Approval and Routing
Each tier has a defined response window and approval path. P1 and P2 work orders trigger instant mobile alerts.
| Item | Frequency | Priority | Status |
|---|---|---|---|
| P1 — Emergency: response under 4 hours, shift supervisor approval | Per work order | Critical | ☐ Pass ☐ Flag |
| P2 — Urgent: response 24–48 hours, maintenance lead approval | Per work order | Monitor | ☐ Pass ☐ Flag |
| P3 — Scheduled: response 1–2 weeks, standard planning cycle | Per work order | Routine | ☐ Pass ☐ Flag |
| P4 — Routine: next PM cycle, batched with routine PMs | Per work order | Routine | ☐ Pass ☐ Flag |
| Photo evidence captured for all FLAG findings | Per work order | Critical | ☐ Pass ☐ Flag |
Zone 5 — Review and Escalation
Quarterly reviews keep the matrix aligned with actual asset condition. Escalate unresolved P1/P2 items to plant management immediately.
| Item | Frequency | Priority | Status |
|---|---|---|---|
| Probability scores reviewed against actual condition data | Quarterly | Monitor | ☐ Pass ☐ Flag |
| Consequence ratings reviewed after major incident or change | Annually | Monitor | ☐ Pass ☐ Flag |
| Backlog sorted by priority tier — P1/P2 at top | Daily | Critical | ☐ Pass ☐ Flag |
| Escalation log for P1 items not resolved within 4 hours | Per event | Critical | ☐ Pass ☐ Flag |
| Matrix updated after any major operating change | As needed | Monitor | ☐ Pass ☐ Flag |
Inspection Zone Summary
| Zone | Frequency | Critical | Monitor | Routine | Total |
|---|---|---|---|---|---|
| Zone 1 — Probability | Daily / Monthly / Quarterly | 2 | 2 | 1 | 5 |
| Zone 2 — Consequence | Monthly / Quarterly | 2 | 1 | 2 | 5 |
| Zone 3 — Matrix Scoring | Per work order | 4 | 0 | 0 | 4 |
| Zone 4 — Approval & Routing | Per work order | 2 | 1 | 2 | 5 |
| Zone 5 — Review & Escalation | Daily / Quarterly / Annually | 2 | 3 | 0 | 5 |
| Total | — | 12 | 7 | 6 | 25 |
Global Compliance Reference
USA — OSHA 29 CFR 1910.119 (Process Safety Management), NFPA 70E (Electrical Safety), and EPA Risk Management Program (RMP) for chemical hazards. OxMaint auto-schedules all intervals.
Canada — CSA Z462 (Electrical Safety) and provincial OH&S regulations with additional requirements for power generation. OxMaint generates province-specific checklists.
UK — PUWER (Provision and Use of Work Equipment Regulations) and EAWR (Electricity at Work Regulations). OxMaint schedules compliance exams and tracks certifications.
Germany — BetrSichV (Operational Safety Ordinance) and TRBS (Technical Rules for Operational Safety). OxMaint coordinates TÜV/DEKRA scheduling with dual-language records.
Australia — WHS Act and state-based electrical safety regulations. OxMaint generates state WorkSafe documentation.
Saudi Arabia — SBC / SASO with Saudi Aramco standards for power generation. OxMaint supports Arabic documentation and SASO tracking.
OxMaint lets you define probability and consequence scales once, then every new fault report, inspection finding, or sensor alarm is scored against your matrix instantly. Work orders are auto-tagged P1 through P4, routed to the right approver, and surfaced on a live dashboard so nothing critical sits buried under routine tickets.
Frequently Asked Questions
Every minute spent debating which work order to dispatch next is a minute the highest-risk fault on your plant keeps running unattended. OxMaint builds the matrix, scores every ticket automatically, and puts the riskiest repair at the top of every technician's queue.