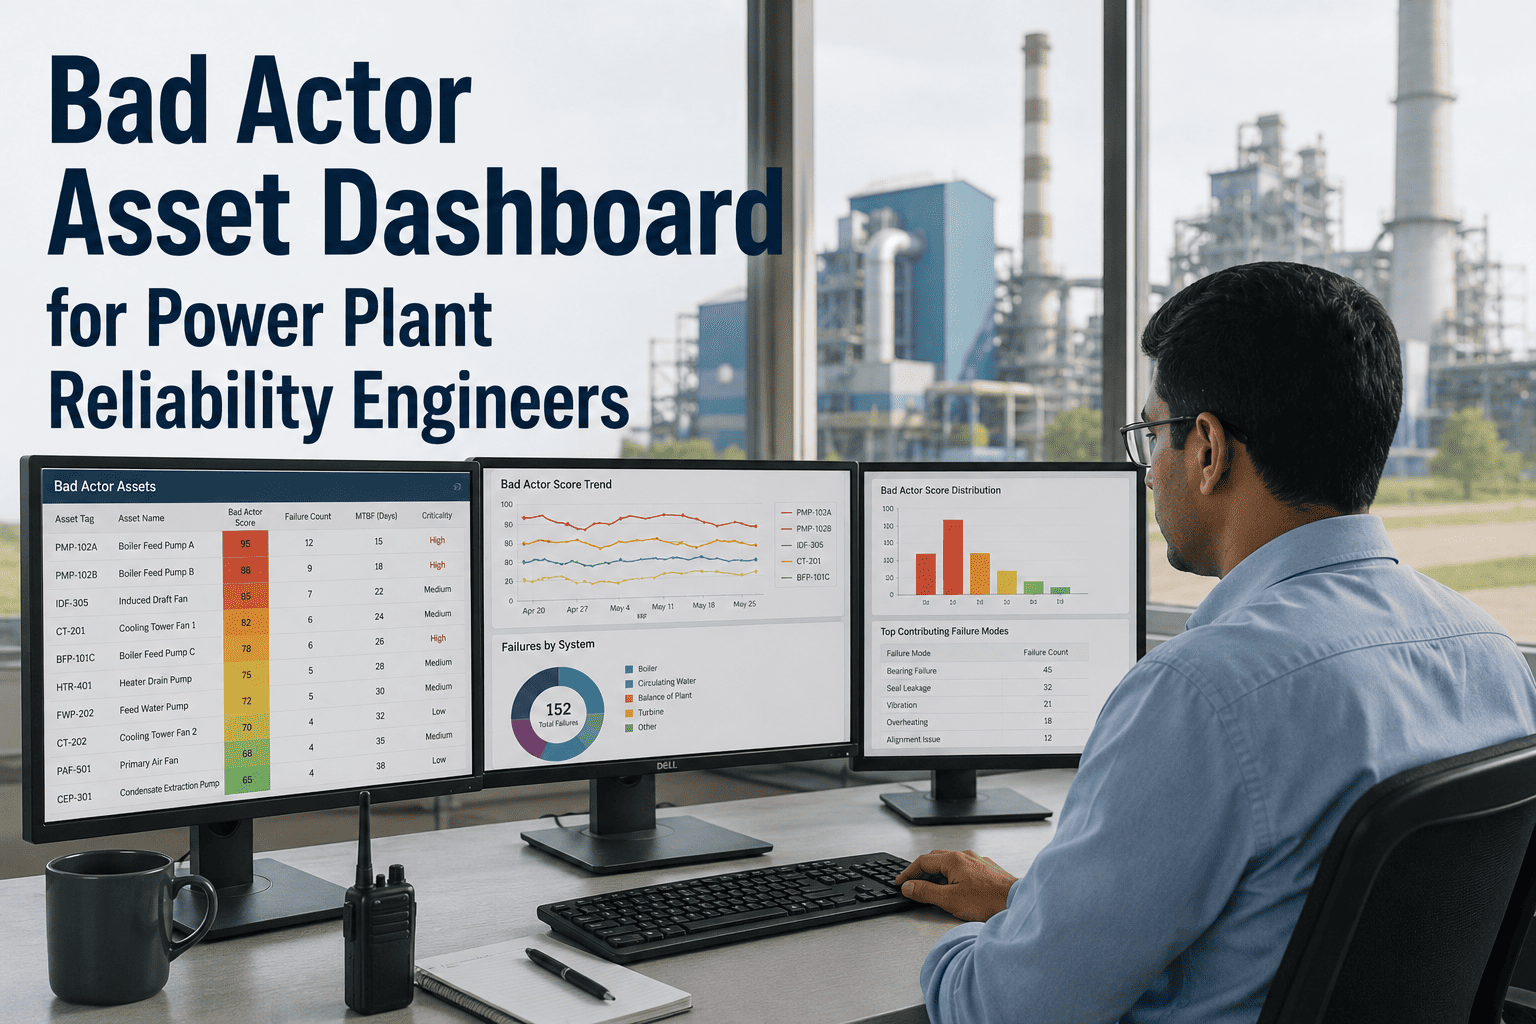
Power plant capital planning meetings tend to follow the same script: finance shows a depreciation schedule that says an asset still has two years of book value left, while the maintenance team is fielding the third emergency repair on that same asset this quarter. Neither side is wrong, but neither side is looking at the same picture, and that gap between the spreadsheet and the shop floor is exactly where capital budgets get blown by 20 to 40 percent. A capital planning dashboard built on live maintenance data closes that gap by turning work orders, parts spend, and condition trends into the financial inputs finance actually needs. OxMaint rolls every asset's lifecycle cost, health score, and replacement-threshold proximity into one reliability investment dashboard, so the next capital request is grounded in numbers everyone is already looking at — sign up free to connect your first assets, or book a demo to see the dashboard built around your fleet.
ANALYTICS & REPORTING · CAPITAL PLANNING
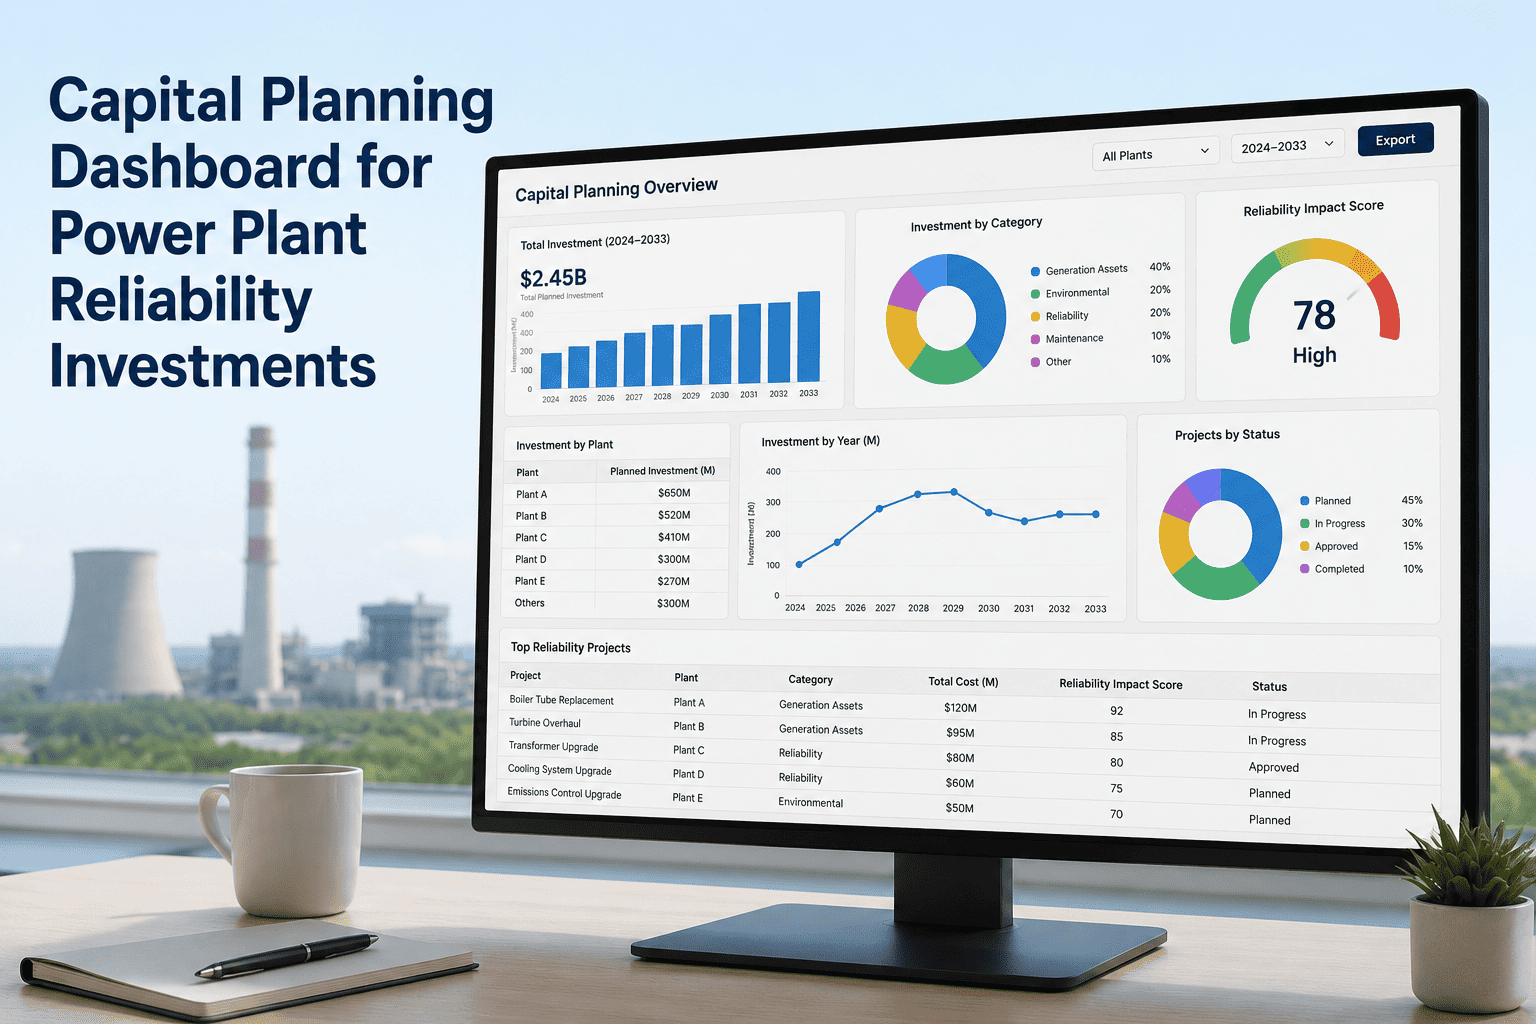
Capital Planning Dashboard for Power Plant Reliability Investments
Turn work orders, parts spend, and condition trends into one live dashboard that shows exactly which assets justify capital investment this year, and which ones can safely wait.
±8%
Capital plan accuracy
$400K-$900K
Savings per asset
12-18 Mo
Lead time visibility
WHY SPREADSHEET CAPITAL PLANS FALL APART
The Disconnect Between the Budget and the Shop Floor
DISCONNECT
Maintenance history lives in one system, depreciation in another, and condition data in a third
DISCONNECT
Premature replacement wastes 20-30% of capital budgets on assets with years of life left
DISCONNECT
Running assets too long risks catastrophic failure, safety exposure, and forced outages
DISCONNECT
Capital requests get challenged when the numbers cannot be traced back to source data
INSIDE THE DASHBOARD
What the Reliability Investment Dashboard Shows
Every card below is built automatically from data that already exists in your maintenance operation — work orders, parts transactions, downtime events, and inspections. Nothing extra to enter, nothing extra to maintain.
Asset Health Scores
Every asset is benchmarked against its fleet class average, so the worst-performing units surface first without manual review.
Lifecycle Cost Register
Every work order, parts transaction, and downtime event rolls up automatically into a lifetime cost total per asset.
Replacement Threshold Proximity
Assets approaching the point where cumulative repair cost nears 60-70% of replacement cost are flagged for review.
Repair vs Replace Recommendations
Data-driven replacement timing can save $400K to $900K per major asset compared to reactive decisions.
Capital Budget Accuracy Tracking
Five-year capital plans built on lifecycle data run accurate to within roughly 8%, versus as much as ±40% with calendar assumptions.
Insurance & Warranty Documentation
Documented condition histories can reduce insurance premiums by 12-18% and help protect OEM warranty claims.
See Your Fleet's Reliability Dashboard in Action
OxMaint's onboarding team connects your first assets and builds a working dashboard view from your existing maintenance records.
HOW IT WORKS
From Maintenance Records to Capital Plan in Four Steps
01
Connect Assets
Existing maintenance records, parts data, and inspection history connect into OxMaint within days of onboarding.
02
Build Lifecycle Registers
Every work order and transaction rolls into a lifetime cost total and health score for each asset.
03
Surface the Dashboard
The reliability investment dashboard ranks assets by replacement-threshold proximity and savings potential.
04
Export to Capital Plan
Dashboard views export directly into the annual capital budget cycle with supporting data attached.
SPREADSHEET VS DASHBOARD
What Changes When Capital Planning Has One Source of Truth
| Factor | Spreadsheet Capital Planning | OxMaint Dashboard |
| Data sources |
Maintenance, finance, and SCADA in separate systems |
Unified lifecycle register per asset |
| Replacement timing |
Based on depreciation schedule or age |
Based on condition and cost threshold |
| Budget accuracy |
Off by as much as ±40% against actuals |
Accurate to within roughly ±8% |
| Repair vs replace savings |
Not quantified |
$400K-$900K per major asset on average |
| Audit trail |
Rebuilt manually for each request |
Exportable with every dashboard view |
EXPERT REVIEW
Priya Nair, MBA, CMRP
VP of Asset Strategy — Multi-Site Power Generation Portfolio, 19 Years
The capital planning meeting I dread least is the one where maintenance and finance are looking at the same dashboard. It sounds simple, but most plants have never had that. Finance trusts a depreciation curve because it is the only number they have, and maintenance trusts their own judgment because it is the only data they trust. A shared lifecycle register does not replace either group's judgment, it gives both groups the same starting point, and that alone removes most of the friction from the budget cycle.
FREQUENTLY ASKED
Capital Planning Dashboard — Common Questions
What data does the capital planning dashboard pull from?
It pulls directly from OxMaint's maintenance records — work orders, parts transactions, downtime events, and inspections. No separate data entry is required once assets are connected.
Sign up free to connect your first assets.
How accurate are the capital budget projections compared to spreadsheet models?
Plants using lifecycle-based dashboards report 5-year capital plans accurate to within roughly 8%, compared to as much as ±40% with calendar or age-based assumptions.
Can the dashboard show repair-vs-replace savings for individual assets?
Yes. When cumulative repair cost approaches 60-70% of replacement cost, the dashboard flags the asset and estimates savings from data-driven timing, often $400K to $900K for major equipment.
Book a demo to see this for your assets.
Does the dashboard work across multiple plants and asset types?
Yes. OxMaint supports multi-site portfolios, so the dashboard can roll up reliability investment priorities across an entire fleet or filter down to a single plant or asset class.
How long does it take to get a working dashboard after signing up?
Most teams connect their first assets within days, and a working dashboard view takes shape within the first few weeks as work order history populates the lifecycle registers.
Book a demo to scope a timeline for your portfolio.
OXMAINT · CAPITAL PLANNING
Give Finance and Maintenance the Same Numbers
OxMaint's capital planning dashboard turns lifecycle data into a single source of truth for reliability investment decisions, so every capital request is backed by a record everyone can see.