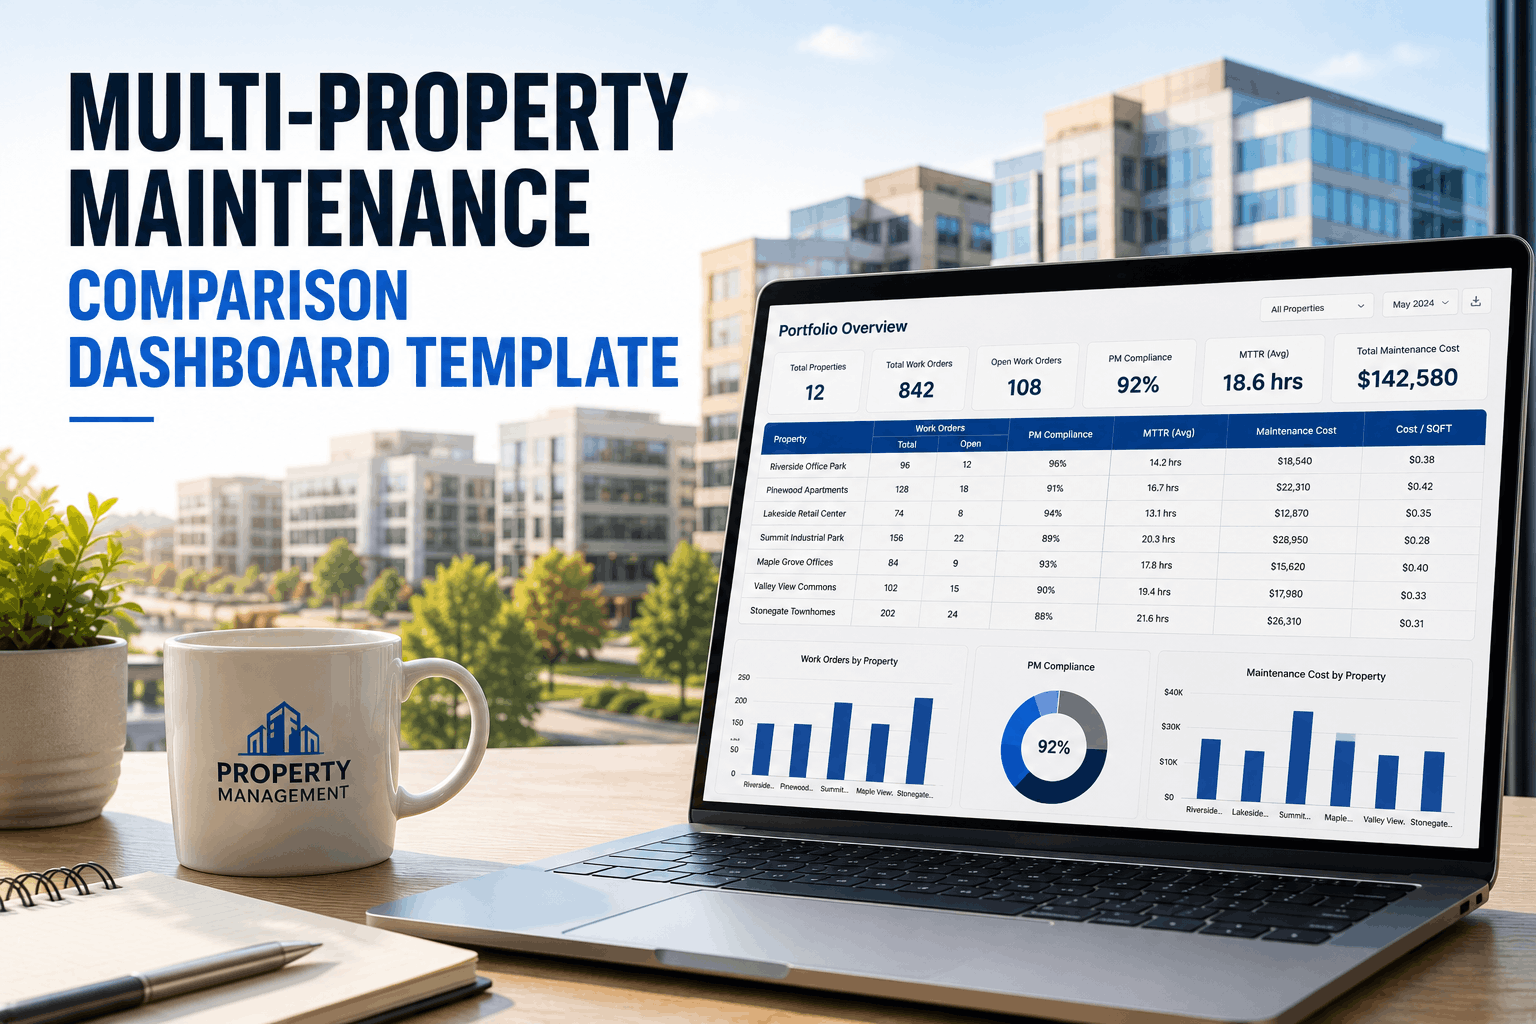
Portfolio directors managing 20–200 properties across multiple states struggle to identify underperforming buildings, benchmark maintenance spending across similar property types, and make capital allocation decisions when data is fragmented across separate CMMS systems, spreadsheets, and property manager reports. One manager reports that Building A spends $45 per unit annually on maintenance; another reports Building D at $52 per unit. Is Building D genuinely less efficient, or does it house larger units with different system types, face different climate conditions, or simply have older equipment? Without standardized comparison metrics and visibility into the drivers of spending variance, portfolio leaders can't distinguish actionable insights from noise and end up making capital decisions based on incomplete data or property manager intuition. OxMaint's multi-property maintenance comparison dashboard consolidates performance metrics across all buildings in a single view — showing cost per unit, maintenance frequency by category, compliance status, asset age, and key performance indicators that let portfolio directors identify which buildings warrant capital investment, which are operating efficiently, and where standardization opportunities exist across the portfolio — enabling data-driven capital allocation and property-level performance accountability.
Property Portfolio · Dashboard
Multi-Property Maintenance Comparison Dashboard Template
Free Editable Dashboard Template for Property Portfolios — Performance Metrics, Cost Comparison, Compliance Status, and KPIs Across All Buildings for U.S. Property Directors
42%
Of portfolio directors can't compare maintenance performance across properties in their portfolio
18%
Average cost variance between best and worst-performing similar buildings in same portfolio
$2–8M
Annual capital reallocation opportunity from benchmarking 50+ property portfolio
6
Key metrics needed to compare maintenance performance fairly across different building types
Why Portfolio Benchmarking Requires Standardized Comparison Metrics
Comparing Building A's maintenance costs to Building B requires controlling for differences in size, age, tenant profile, and system types. Cost per unit normalizes for building size. Cost per square foot enables comparison of different unit configurations. Maintenance frequency by category (HVAC, plumbing, electrical) reveals whether spending variance is driven by specific system failures or general deterioration. Unplanned vs. planned maintenance split shows whether buildings are in reactive or proactive maintenance modes. Compliance status tracks whether buildings are meeting regulatory deadlines and brand franchise requirements. Asset age ranking identifies which buildings have the oldest equipment and therefore highest future capital needs. Without these normalized metrics, portfolio directors comparing raw annual spending are comparing apples to oranges and making capital decisions on incomplete information.
Portfolio benchmarking also surfaces standardization opportunities: if eight similar apartment buildings average $8K annual HVAC spending but two buildings spend $12K and two spend $5K, investigating the high-spending buildings may reveal contractor overcharging, while low-spending buildings may be underinvesting in preventive maintenance. Schedule a demo to see how OxMaint creates apples-to-apples comparisons across your entire property portfolio.
Multi-Property Performance Scorecard: Comparing 12 Similar Buildings
Building
Units
Cost/Unit
Age (yrs)
Compliance
Performance
Building A
24
$2,100
8
100%
B+
Building B
20
$1,850
6
100%
A-
Building C
28
$2,650
12
92%
C
Building D
22
$3,100
15
78%
D
Building B: efficient 6-year-old property, above-average compliance. Building D: high cost per unit + compliance gaps suggest deferred maintenance and aging systems requiring capital review.
Cost Distribution Across Portfolio: Identifying High-Spend Outliers
Maintenance Cost Per Unit - Portfolio Distribution (12 Buildings)
Two buildings (17%) cluster above $3K/unit — investigating high-spend drivers could identify contractor issues or deferred capital needs.
How Portfolio Directors Use Comparison Dashboards for Capital Allocation
1
Identify Cost Outliers Requiring Investigation
Dashboard shows Building D at $3,100/unit vs. portfolio average $2,350/unit. Portfolio director investigates: is this due to unit size difference, equipment age, location, or contractor pricing? OxMaint's drill-down detail shows whether it's system-specific (HVAC) or general deterioration.
2
Benchmark Similar Buildings for Performance Comparison
Building A (8 years old, $2,100/unit) vs. Building C (12 years old, $2,650/unit). If similar age and size, why the 25% cost difference? Building C may have aging systems or less rigorous preventive maintenance. This comparison drives decisions about whether to invest in Building C's preventive maintenance or accept higher emergency repair costs.
3
Forecast Capital Needs Across Portfolio
Buildings with highest age + highest maintenance costs signal imminent capital needs. A 15-year-old building at $3K/unit likely has equipment approaching end-of-life. Comparing age and cost trends across the portfolio lets directors forecast multi-year capital requirements and plan financing.
4
Standardize Maintenance Approaches Across Similar Buildings
If Buildings B and D are identical 20-unit apartment complexes but have 30% cost variance, identifying why (contractor choice, PM rigor, equipment vintage) allows portfolio directors to standardize the lower-cost approach across all properties. This drives portfolio-wide cost reduction opportunities.
We manage 45 apartment buildings across three states. Before OxMaint, I had zero visibility into whether costs were high because buildings were old, because property managers were underperforming, or because of contractor pricing. The comparison dashboard showed me that two buildings with identical specs had 35% cost variance — investigating revealed one PM was deferring preventive maintenance while the other was proactive. Standardizing the proactive approach across similar buildings will save us $200K annually.
— Portfolio Director, Multi-State Residential Properties, Northeast
FAQ — Multi-Property Maintenance Comparison for U.S. Portfolio Directors
How should cost per unit be calculated when buildings have different unit sizes?
Use cost per square foot as the primary metric (total annual cost ÷ total square feet) rather than cost per unit. This normalizes for unit size differences and enables fair comparison of different building types. Cost per unit is secondary and useful only for identical unit types.
Can comparison dashboards account for climate differences between properties in different states?
Yes. OxMaint allows you to tag buildings by climate zone and compare only similar-climate buildings. A New England apartment complex naturally has higher heating costs than a Southern property. Climate-normalized comparisons reveal genuine efficiency differences vs. climate-driven variation.
How often should portfolio directors review the comparison dashboard?
Monthly review catches emerging trends. Quarterly deep dives (investigating outliers and cost variance drivers) support capital planning. Annual reviews benchmark full-year performance and trend analysis. OxMaint automates monthly generation; directors just review the highlights and drill down on exceptions.
Can property managers be held accountable using comparison dashboard metrics?
Yes. Dashboard metrics (cost per unit, compliance status, maintenance frequency) create transparent performance accountability. Property managers seeing their building benchmarked against peers understand cost expectations and compliance requirements. This drives performance improvement without top-down mandates.
What KPIs should be included in a multi-property comparison dashboard?
Core metrics: cost per unit/sqft, maintenance frequency by category, compliance status, asset age, planned vs. unplanned spend percentage, mean time between failures by system. Optional: contractor performance ratings, energy efficiency comparisons, tenant satisfaction correlation. OxMaint templates include all standard metrics.
How does a comparison dashboard support capital budgeting decisions?
Buildings with highest age + highest maintenance costs signal imminent capital needs. Dashboard trends show which buildings are likely to need major replacements within 3–5 years. This drives multi-year capital forecasting and helps prioritize projects across a large portfolio.
Can OxMaint create custom KPIs or weighted scoring for buildings?
Yes. OxMaint's dashboard builder allows custom KPIs based on your portfolio strategy. Example: assign 40% weight to cost control, 30% to compliance, 20% to maintenance efficiency, 10% to tenant satisfaction. Buildings receive a composite performance score reflecting your priorities.
OxMaint · Portfolio Dashboards
Compare All Your Properties in One View — Make Data-Driven Capital Decisions
OxMaint's multi-property dashboard gives portfolio directors the visibility needed to benchmark performance, identify outliers, forecast capital needs, and standardize best practices across their entire property portfolio.