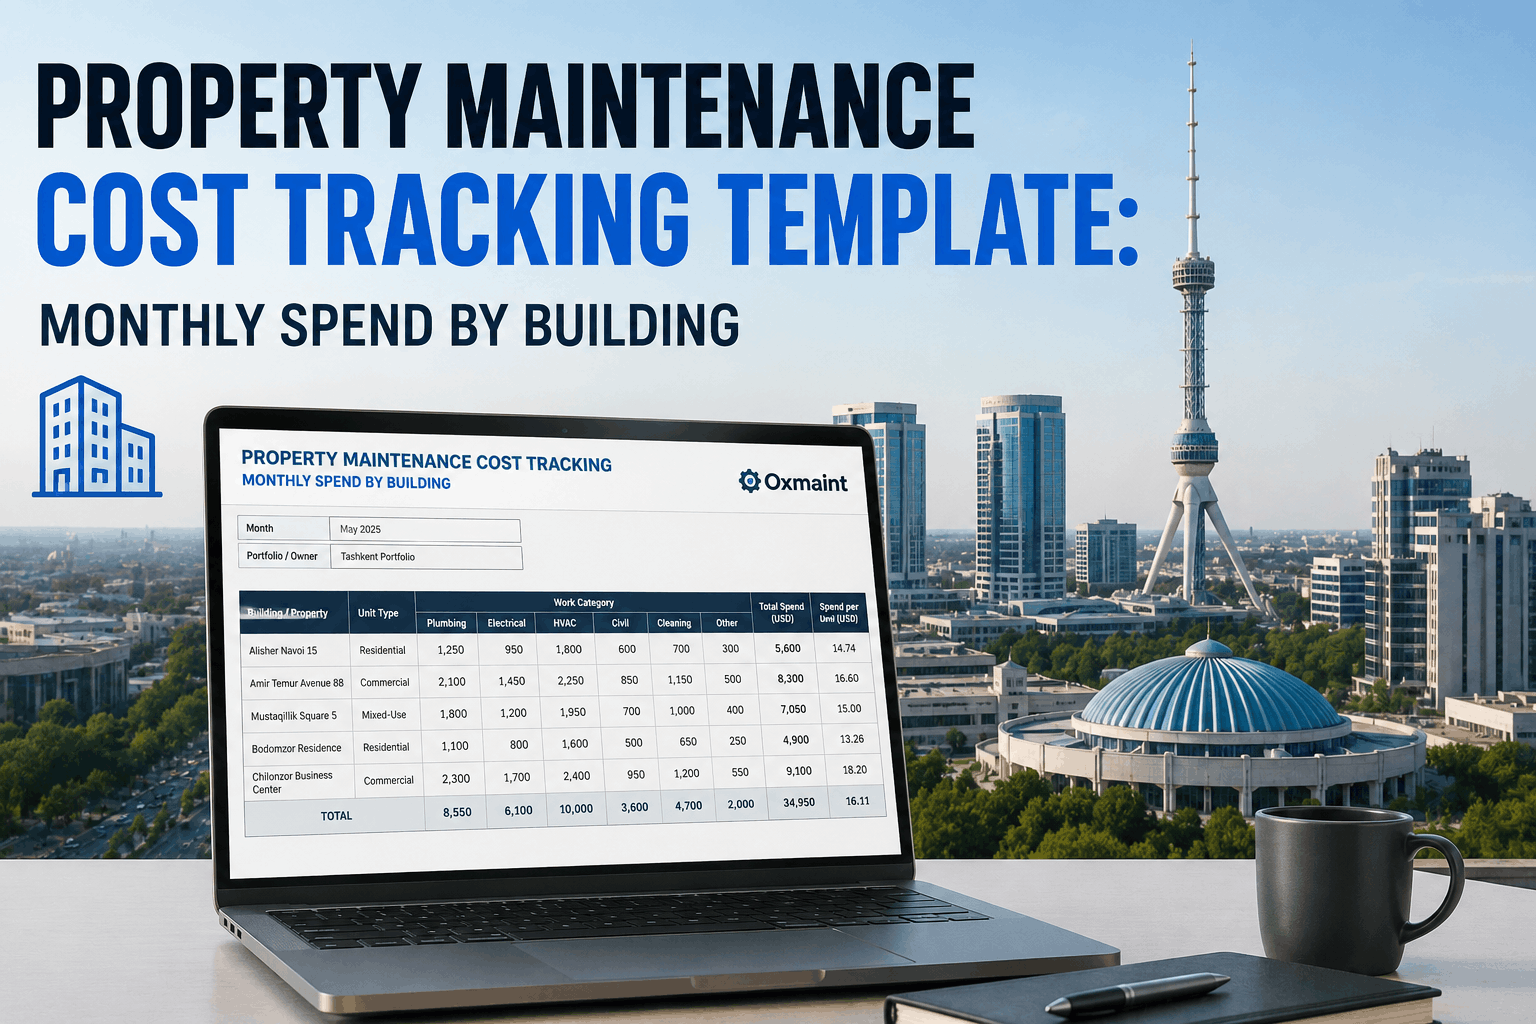
Property managers overseeing portfolios of 10–100+ residential or commercial units face a critical challenge: tracking maintenance spending across multiple buildings, unit types, and work categories without visibility into whether costs are rising due to aging assets, inefficient repairs, or genuine market inflation in contractor labor. A property finance team budgets $50K annually for maintenance across 25 apartment units, but by Q3 they've spent $62K and have no clear picture of where overspend occurred — was it emergency plumbing repairs in Building A, deferred AC maintenance finally catching up, or contractor rate increases? Without structured monthly cost tracking linked to asset-level work orders, property managers can't distinguish between one-time emergency repairs and systemic deterioration requiring capital investment decisions. OxMaint's property maintenance cost tracking template consolidates monthly spending by building, unit type, and work category into a visual dashboard that shows property finance teams exactly where maintenance dollars are going and flags cost trends that indicate asset-specific problems or portfolio-wide deterioration patterns — enabling data-driven decisions about which buildings need capital improvements vs. which can operate safely under preventive maintenance budgets.
Property Management · Cost Tracking
Property Maintenance Cost Tracking Template: Monthly Spend by Building
Free Editable Monthly Cost Tracking Template for Property Portfolios — Spending by Building, Unit Type, Work Category, and Variance Analysis for U.S. Property Managers
28%
Of property managers can't track maintenance costs by building or unit type accurately
$15–40K
Annual cost variance per building due to untracked spending across multiple contractors
35%
Of property portfolios overspend maintenance budgets by Q3 due to lack of monthly visibility
12
Monthly cost tracking cycles needed to identify spending patterns and asset deterioration trends
Why Monthly Maintenance Cost Tracking Matters for Property Finance Teams
Property finance managers make capital budget decisions based on five-year maintenance spend trends, but without structured monthly tracking, they're working from incomplete data. Building A shows $8K in annual maintenance costs historically but $12K this year — is this normal seasonal variation, contractor rate increases, or a sign that the 15-year-old HVAC system is failing and needs replacement? Without month-by-month visibility, the finance team can't distinguish signals from noise and ends up making capital decisions based on guesswork rather than data. Structured monthly cost tracking by building and work category reveals patterns: Building A's air conditioning costs jumped from $400/month to $800/month in March (potentially indicating compressor efficiency loss), electrical costs in Building C are rising 8% year-over-year, plumbing emergencies in Building D consumed 22% of annual maintenance budget in Q2 alone. These patterns trigger targeted investigations and capital project decisions — "Building A's AC trend suggests replacement within 18 months" becomes a testable hypothesis with cost data, not a maintenance engineer's hunch.
Monthly cost tracking also reveals contractor performance variance. Two contractors providing similar services — one charges $120/hour, the other $145/hour. With tracking by vendor, property managers can calculate true cost-per-service and identify underperforming contractors or rate increases. Schedule a demo to see how OxMaint structures monthly cost tracking that surfaces actionable insights for capital planning and contractor management.
Monthly Cost Tracking by Building: Sample Data for 25-Unit Portfolio
Building
Units
Jan Cost
Feb Cost
Mar Cost
Avg/Mo
YTD Total
Budget Var
Building A (Apt Complex)
8
$1,200
$1,400
$2,100
$1,567
$4,700
+18%
Building B (Office)
5
$900
$850
$920
$890
$2,670
-8%
Building C (Mixed Use)
7
$1,550
$1,680
$1,620
$1,617
$4,850
+3%
Building D (Townhomes)
5
$750
$820
$3,200
$1,590
$4,770
+58%
Building D's March spike ($3,200) driven by emergency sewer line replacement ($2,400). YTD variance shows Building A and D trending above budget; Buildings B and C tracking within forecast.
Cost Breakdown by Work Category: Where Maintenance Dollars Go
Quarterly Maintenance Spend Distribution (25-Unit Portfolio)
HVAC & Heating
35%
Plumbing & Water
22%
Electrical & Lighting
18%
Roofing & Exterior
15%
Appliances & Other
10%
HVAC dominates maintenance spending across U.S. properties. Plumbing emergencies create unpredictable cost spikes. Roofing and exterior typically follow predictable seasonal patterns.
How OxMaint Structures Monthly Cost Tracking for Data-Driven Capital Decisions
1
Link Every Work Order to Building & Cost Category
When maintenance is performed, the work order captures building ID, unit number, work category (HVAC, plumbing, electrical), contractor, labor hours, and material costs. This data is automatically aggregated by OxMaint into monthly reports by building and category.
2
Generate Monthly Cost Summary by Building
OxMaint produces a standard monthly cost report showing each building's total maintenance spending, breakdown by category, variance from budget, and comparison to historical months. Property finance can see immediately whether spending is on track or trending above/below forecast.
3
Identify Cost Trends & Outliers
Year-over-year comparison shows cost increases at the building level. A 30% year-over-year increase in HVAC costs at Building A in March signals potential equipment failure. OxMaint highlights these trends automatically rather than requiring manual spreadsheet analysis.
4
Support Capital Planning With Cost Trajectory Analysis
Monthly cost trending data feeds capital project ROI analysis. If Building A's AC maintenance costs are rising 8% annually and HVAC is the largest maintenance category, a $12K AC replacement becomes justified by maintenance cost avoidance alone, independent of occupancy or revenue considerations.
Before OxMaint, I didn't know which of my eight apartment buildings was driving maintenance cost overruns. By month three, I'd spent $65K against a $60K annual budget but had no visibility into whether it was seasonal variation or genuine asset deterioration. With monthly cost tracking by building, I discovered Building D's aging water heater was generating emergency plumbing calls that consumed 18% of annual maintenance budget. That data justified a $5K equipment replacement that avoided $8K in annual emergency repairs going forward.
— Portfolio Manager, 45-Unit Residential Property, Midwest
FAQ — Property Maintenance Cost Tracking for U.S. Property Managers
How should maintenance costs be allocated across buildings with different unit counts?
Track absolute costs by building first, then calculate normalized metrics: cost per unit (total building cost ÷ number of units) and cost per square foot. This lets you compare 5-unit and 20-unit buildings fairly and identify which are truly more expensive to maintain vs. just larger.
What's a normal year-over-year increase in maintenance costs for aging properties in the U.S.?
Properties over 20 years old typically see 6–12% annual maintenance cost increases due to equipment aging and deferred maintenance catch-up. A 20% increase signals urgent capital needs. OxMaint's cost trending helps distinguish seasonal variation from genuine deterioration requiring replacement decisions.
Can cost tracking differentiate between emergency repairs and preventive maintenance spending?
Yes. OxMaint's work order system captures work type (PM vs. emergency), so cost reports show maintenance costs split by category. High emergency spending at one building signals deferred PM or equipment-end-of-life, helping justify capital replacement decisions.
How does contractor pricing variance affect cost tracking across multiple properties?
OxMaint tracks costs by contractor and calculates cost-per-service (labor hours + materials). If Contractor A charges $120/hour and Contractor B $145/hour for identical services, cost tracking reveals pricing variance. This supports vendor negotiation and performance evaluation across your portfolio.
Can property managers forecast next year's maintenance budget based on monthly cost history?
Yes. Twelve months of cost data by building and category reveals seasonal patterns (HVAC in summer/winter, roofing in dry seasons) and trend lines. OxMaint's budget forecasting tool projects next year's costs based on historical data and assumptions about contractor inflation and asset age.
How should property owners present maintenance cost trends to investors or lenders?
Use normalized metrics: cost per unit per month, cost per square foot annually, percentage of revenue spent on maintenance. Show year-over-year trends with context (equipment replacements, contractor rate changes). OxMaint generates investor-ready reports with these metrics automatically.
Do large properties (100+ units across multiple buildings) need different cost tracking approaches?
Larger portfolios benefit from portfolio-level dashboards showing rollup costs, but also need building-level granularity for decision-making. OxMaint supports hierarchical reporting: corporate finance sees portfolio total, building managers see their building's costs and peer comparisons.
OxMaint · Property Cost Tracking
Stop Guessing About Maintenance Costs — Track Spending by Building in Real Time
OxMaint's property maintenance cost tracking template gives property finance teams the visibility needed to make data-driven capital decisions, negotiate contractor pricing, and forecast budgets with confidence.


-request-template-for-building-owners.png)