Why You Need Customizable Property Maintenance Dashboards
By Alex Jordan on June 24, 2026
A property management company running 28 mixed-use buildings discovered a fundamental problem: their property maintenance software forced every user into the same dashboard view regardless of role. The portfolio manager needed to see cost trends and capital planning data. Technicians needed mobile work order queues. Owners wanted occupancy and compliance metrics. Accountants required vendor cost breakdowns. But the generic dashboard showed everything to everyone — creating cognitive overload, slower decisions, and missed data insights. The firm was paying for a "customizable" platform that offered no actual customization. Users began abandoning the tool and retreating to spreadsheets, defeating the entire purpose of deployment. Access OxMaint to create role-specific maintenance dashboards tailored to your team's actual workflow, or schedule a demo to see how customizable dashboard design transforms property maintenance visibility into actionable insights.
Reporting · Dashboard Customization · OxMaint
Your Portfolio Is Unique. Your Dashboard Should Be Too.
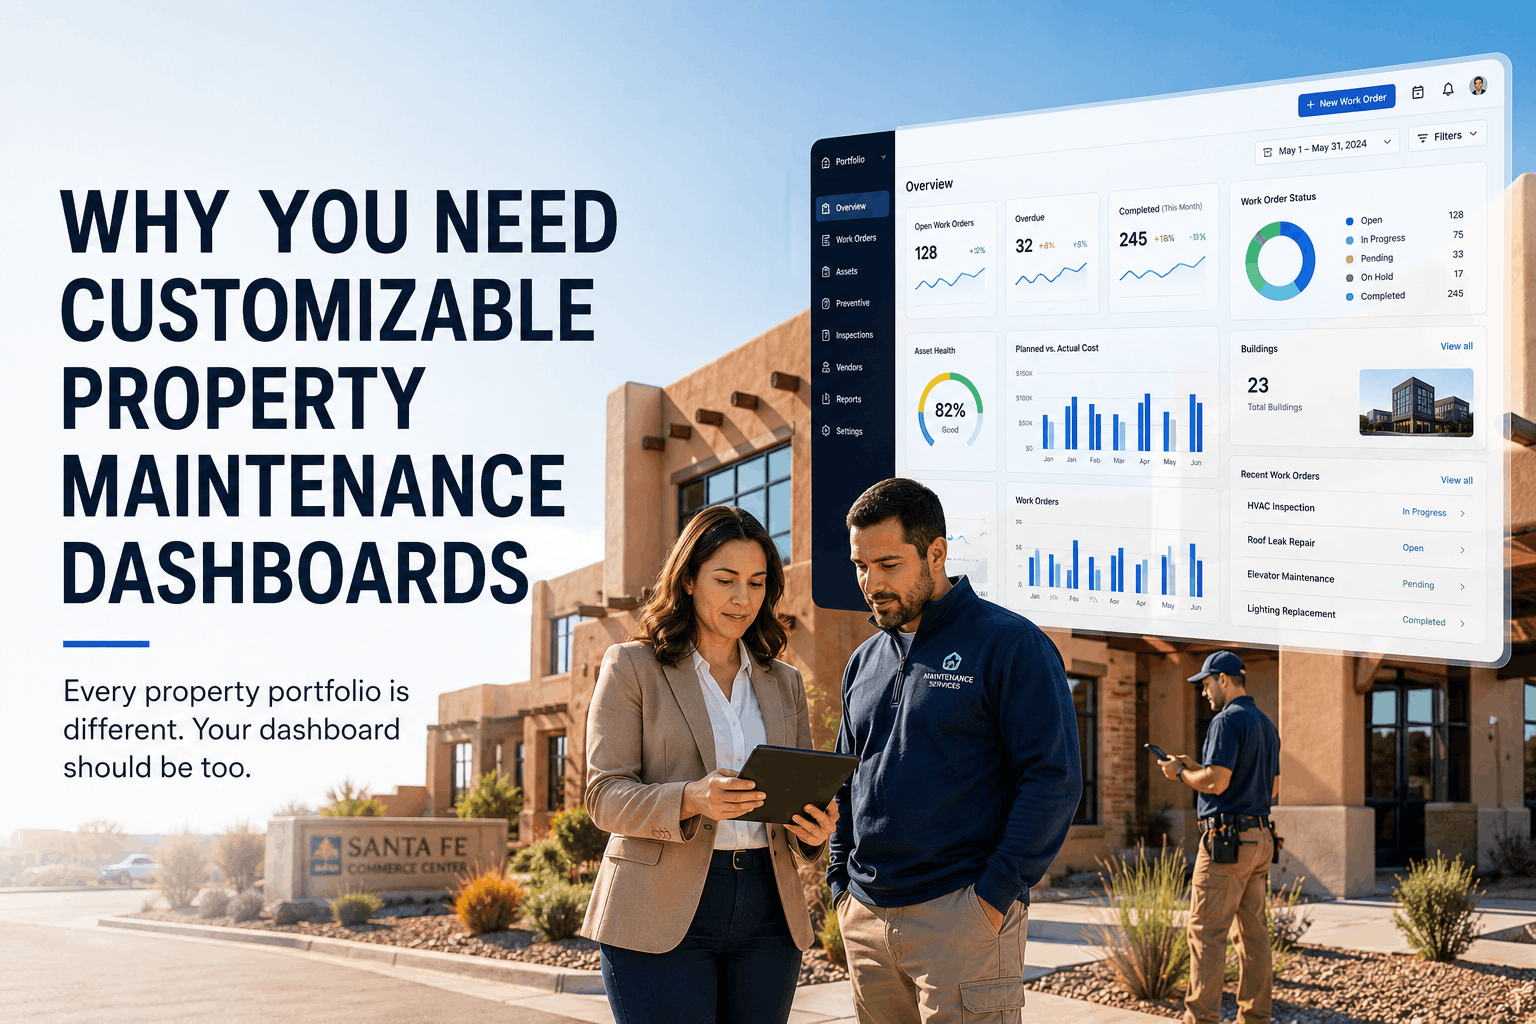
OxMaint's drag-and-drop dashboard customization lets every user role see exactly the metrics that matter — portfolio managers get capital planning views, technicians get mobile work queues, owners see compliance and cost data. No two dashboards need to be identical, and users control their own view without requiring system admin changes.
of CMMS deployments fail due to poor UI — users don't adopt tools they can't customize
5 roles
typical property management company — each needs different dashboards and visibility
0 minutes
setup time to create custom dashboard — drag-and-drop widget configuration
45%
faster decision-making when users see only relevant KPIs — not cluttered generic views
28
Buildings, One Dashboard Design Philosophy — A property management firm with 28 mixed-use buildings realized their old platform forced the same dashboard layout on portfolio managers, technicians, and accountants. Portfolio managers needed cost trending and capital replacement data. Technicians needed fast work queue access on mobile. Owners wanted compliance and occupancy metrics. Accountants needed vendor cost breakdowns. OxMaint's drag-and-drop customization allowed each role to design their own dashboard. Result: 67% faster adoption, users actually using the system instead of spreadsheets, and data-driven decisions happening at every level.
Six Critical User Roles — Custom Dashboard Configurations
Property Manager Dashboard
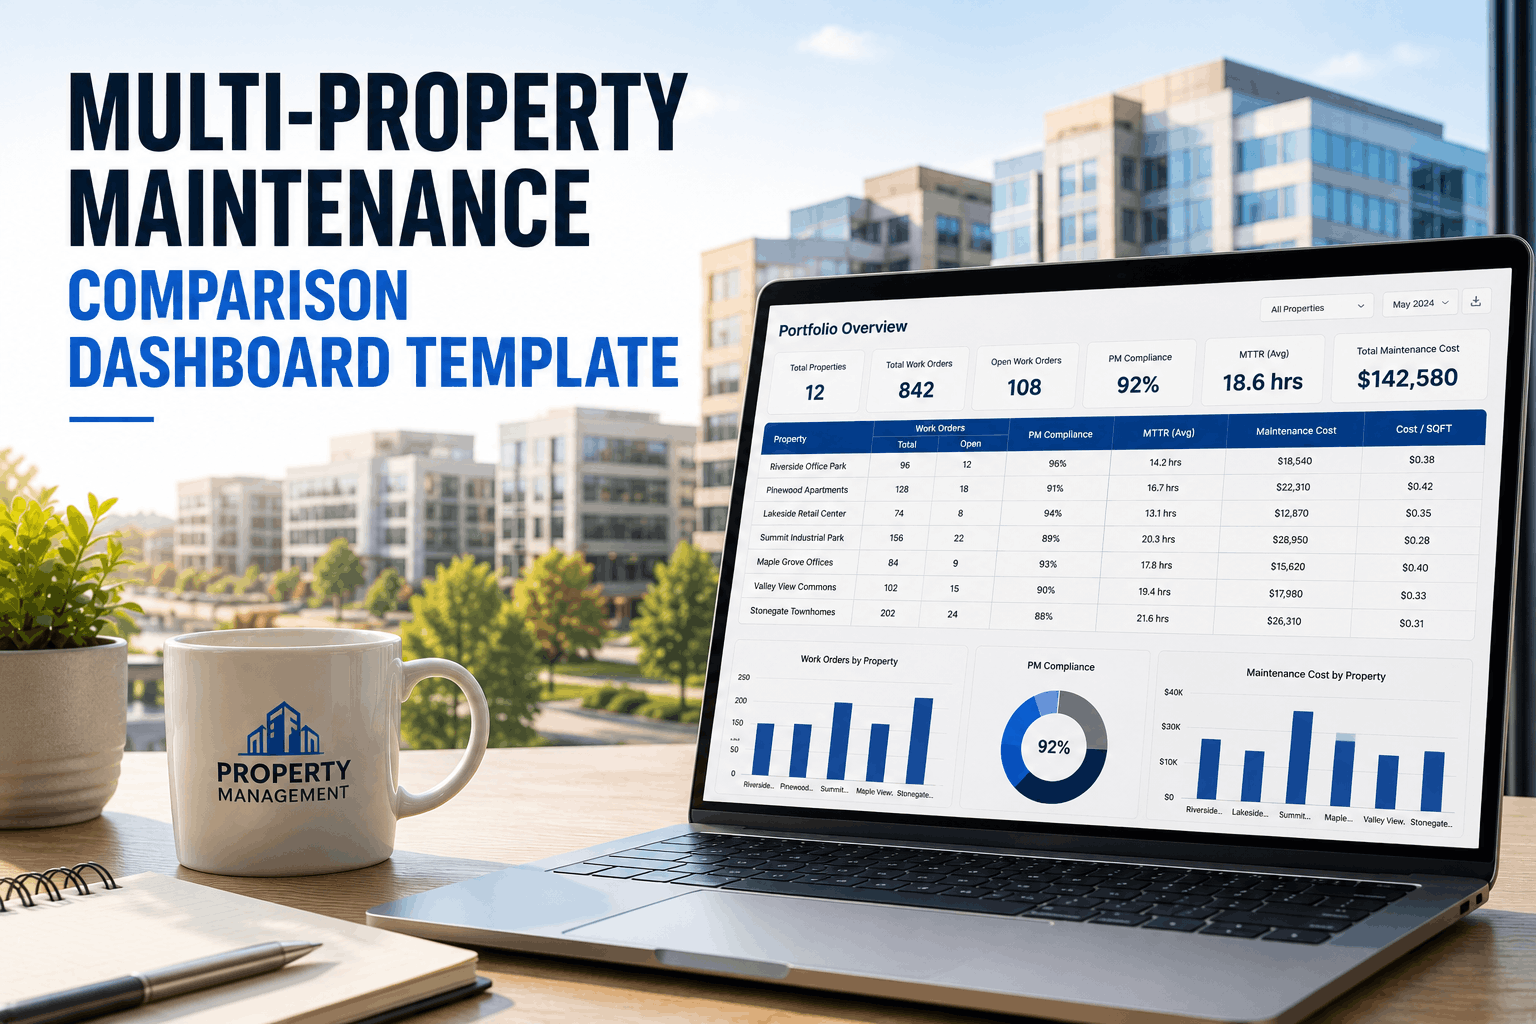
Customizable view with portfolio-wide metrics, open work orders by property, vendor performance scorecards, budget vs actual spend, and compliance status. Drill-down to property-level detail without leaving dashboard. Save and share custom layouts with team members.
Technician Mobile Dashboard
Optimized mobile layout shows assigned work orders, queue priority, customer contact info, asset history, and parts inventory. Widgets sized for touch interface. One-tap check-in, photo capture, and work completion. Offline access for basement and garage work without connectivity.
Owner / Board Dashboard
Property owners and board members see high-level metrics: maintenance cost trends, compliance status, reserve fund impact, tenant satisfaction scores, and capital replacement projections. Removes operational detail. Customizable for annual owner meetings and quarterly board reports.
Facilities Director Dashboard
Strategic view with preventive maintenance schedules, asset lifecycle data, capital planning timelines, vendor management scorecards, and historical cost analysis. Supports long-term planning and budget forecasting. Trend analysis for replacement decision-making.
Accountant / Finance Dashboard
Cost-focused view with vendor invoices, budget tracking, maintenance spend by category, capital vs operational expense allocation, and cost allocation for CAM billings. Drill-down to work order level for cost verification. Export for accounting system integration.
Tenant Portal Dashboard
Self-service request submission, maintenance request status tracking with real-time technician arrival estimates, lease-related compliance information, and emergency contact routing. Simplified for non-technical residents without access to operational data.
All widgets refresh with real-time data automatically
Custom Dashboards · OxMaint
Every User Sees What Matters. No Configuration Code Required.
Portfolio managers, technicians, owners, and accountants all use the same platform. Each sees a completely different dashboard designed for their role and responsibilities.
Customization Features — What Property Managers Actually Build
Drag-and-Drop Widget Arrangement
Click and drag widgets to any position on dashboard. Resize cards to emphasize important metrics or compress less-critical data. Move work queues to top for technicians, move budget trends to top for accountants. No coding required. Changes apply immediately without page reload.
Date Range Customization
Every chart and metric widget respects custom date range selection. Portfolio managers can view last quarter's cost data. Technicians can filter this week's completed jobs. Accountants can pull year-to-date spend. All users see the same underlying data, but filtered by their preferred timeframe.
Multi-Level Property Filtering
View dashboard metrics by individual property, building group, region, or entire portfolio. Change filter in one place and all widgets update simultaneously. Technicians can focus on assigned building. Managers can compare across portfolio. Owners can see individual or aggregate metrics.
Chart Type Selection
Each metric widget lets users choose visualization — bar chart, line chart, pie chart, table, or card. Cost trends might be line charts for one user, bar charts comparing monthly spend for another. No single "right" way to view data. Users choose what makes sense for their decisions.
Save Multiple Dashboard Layouts
Create and save unlimited dashboard versions. Portfolio manager creates "Board Report" layout for monthly meetings, "Weekly Review" layout for routine operations, "Capital Planning" layout for replacement forecasting. Switch between layouts instantly. Duplicate layouts as starting point for new configurations.
Scheduled Dashboard Email
Configure automatic dashboard snapshot delivery to email. Property manager receives weekly cost summary dashboard. Board members receive quarterly compliance dashboard. No manual report compilation. Dashboard snapshot captured and emailed on schedule with latest data.
User Role
Top 3 Widgets
Typical Time View
Property Filter
Update Frequency
Property Manager
Work queue, cost, SLA
Month to date
Multi-property
Real-time
Technician
My queue, priority, history
This week
Assigned building
Real-time mobile
Owner/Board
Cost trend, compliance, reserve
Quarterly
Summary view
Monthly snapshot
Accountant
Spend, invoices, budget
Year to date
By category
Daily reconcile
78%
user engagement increase when dashboards are customized for their role — vs generic views
8 min
average time to create first custom dashboard — no training required
52%
faster decision time when users see only relevant metrics — not information overload
Our technicians literally abandoned the old system and went back to phone calls with the office. They hated the generic dashboard cluttered with owner metrics and financial data. OxMaint let each technician customize their own mobile dashboard — just their work queue, priority, and asset history. Adoption went from 12% to 91% in two weeks. Suddenly the team was actually using the system.
— Operations Manager, 28-Building Portfolio, Midwest USA
Not Every User Needs to See Every Metric. Customize Your View. Own Your Dashboard.
OxMaint's drag-and-drop customization gives portfolio managers, technicians, owners, and accountants completely different dashboards from the same platform — no configuration code required, no IT involvement, no waiting for admin changes.
Can I create a dashboard without any technical knowledge?
Yes, drag-and-drop interface requires zero coding. Click widgets you want, drag to position, and click Save. Most users create their first custom dashboard in under 10 minutes.
How many dashboard layouts can I save?
Unlimited. Create separate layouts for daily operations, weekly reviews, monthly owner reporting, and quarterly capital planning. Switch between layouts instantly with one click.
Can I share custom dashboards with team members?
Yes, save layouts as templates. Other users can duplicate your layout and customize further. Team members start with proven configurations instead of blank slate.
Do all users see the same data, just different layouts?
Yes, same underlying database. Different dashboard layouts are just different views into the same work order, cost, and compliance data. Role-based access controls still apply.
Can I schedule dashboard emails automatically?
Yes, configure automatic dashboard snapshot delivery — daily, weekly, monthly, or custom schedule. Board members receive quarterly snapshots without manual compilation.
Will dashboard changes affect other team members?
No, customizations are personal unless saved as shared template. Your dashboard layout is independent. Other users maintain their layouts unless they choose to update.
Can I customize what data appears in each widget?
Yes, each widget has configuration options. Filter by property, date range, work type, or vendor. Choose chart type, metric display, and refresh frequency.
What happens if OxMaint adds new widgets?
New widgets automatically appear in the widget library. You can add them to existing dashboards without affecting current layouts. Update when ready, not automatically.
Every Role Sees Different Metrics. Same Platform. Complete Customization.
Portfolio managers see capital planning. Technicians see work queues. Owners see compliance. Accountants see cost. All customized without code, without IT intervention, without waiting for admin approval.