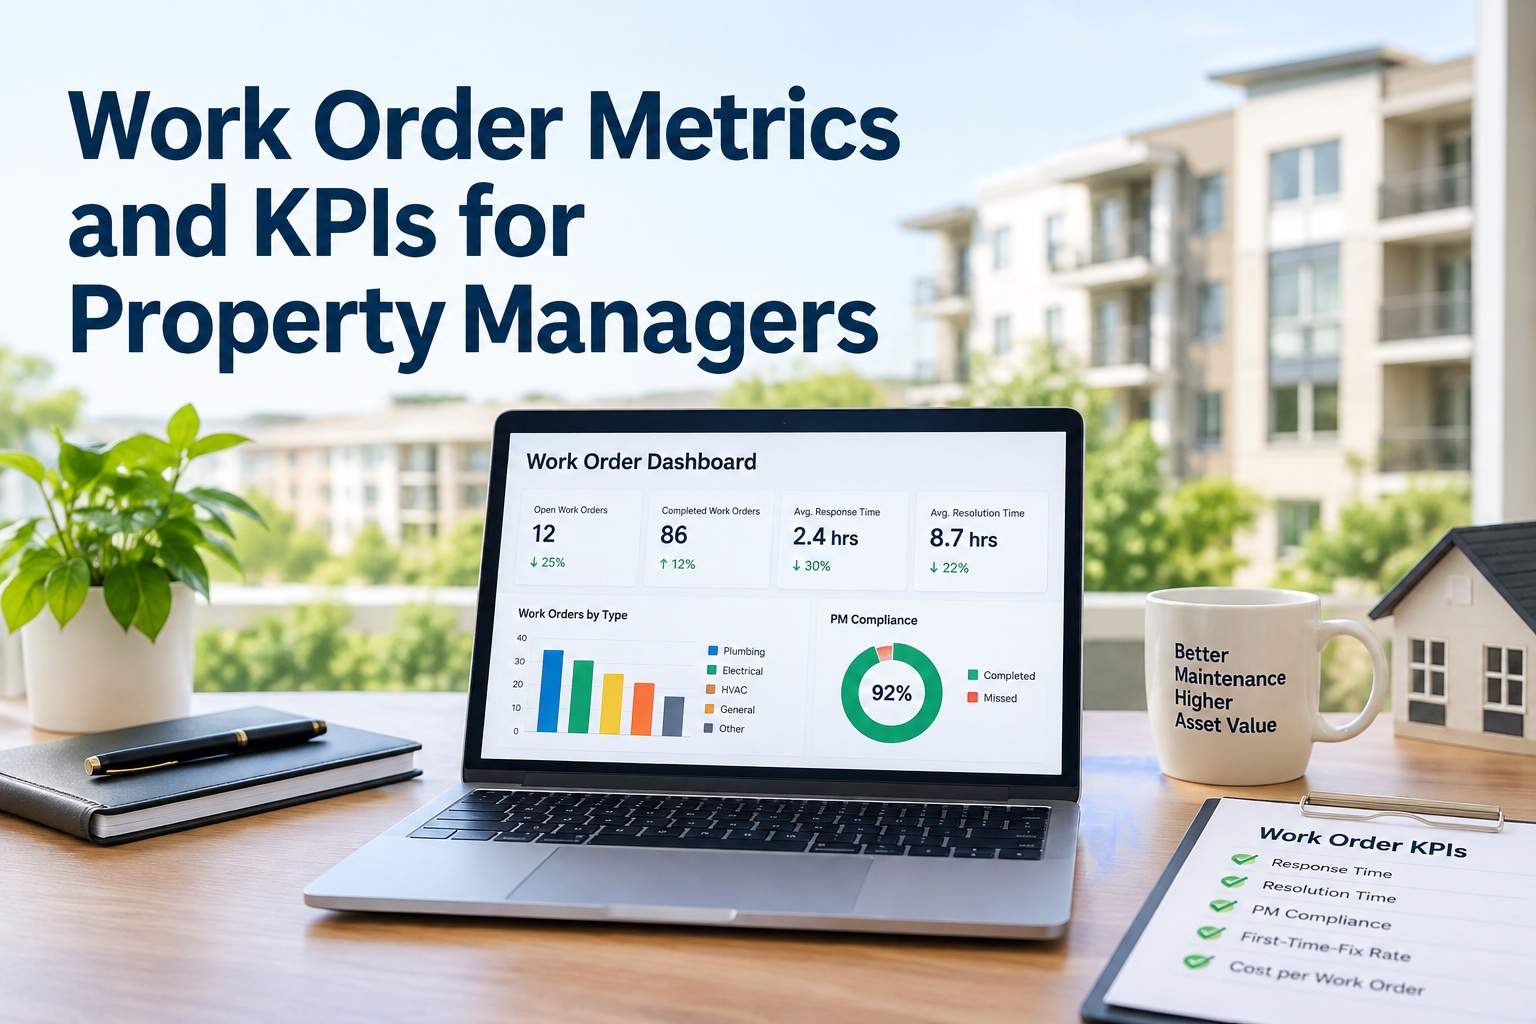
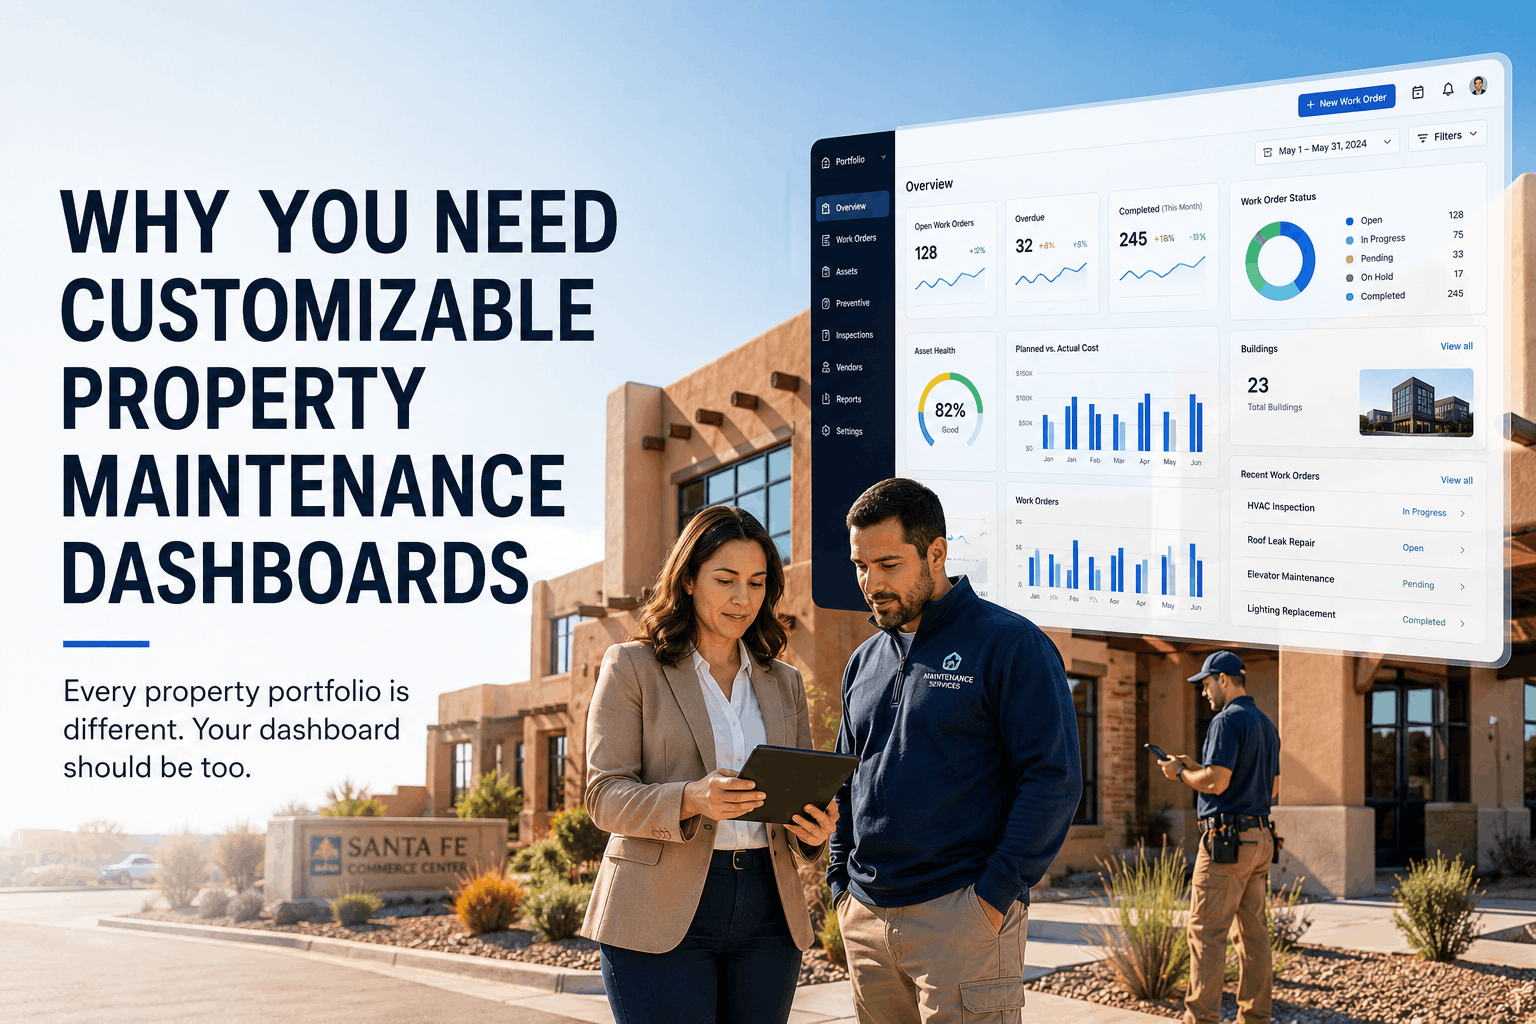
Property maintenance managers who do not use dashboards are managing blind — they cannot see trends, identify underperforming properties, or prove ROI to ownership until after problems become emergencies. A well-designed maintenance dashboard transforms raw work order data into actionable intelligence: which properties have rising response times, which technicians are most productive, which assets are driving emergency spend, and where preventive maintenance is falling behind. Property managers across the United States who implement structured reporting dashboards reduce maintenance costs by 18 to 27 percent within the first 12 months — because they can finally see where waste is hiding. Sign Up Free to access Oxmaint's pre-built maintenance dashboards for property managers. Book a Demo to see how portfolio managers use real-time dashboards to track KPIs across dozens of properties. This guide gives property managers a practical framework to design maintenance dashboards that matter — executive summaries, operational metrics, technician performance, cost tracking, SLA compliance, and asset health — so every dashboard drives action, not just awareness.
Why Maintenance Dashboards Separate High-Performing Portfolios from Reactive Ones
In property management, what gets measured gets managed — but only if the measurement is visible, timely, and actionable. Maintenance dashboards transform scattered work order data into a single source of truth that property managers, regional directors, and ownership can trust. When dashboards are updated in real time, managers spot negative trends before they become crises: a property whose response time has crept from 2 hours to 6 hours over 90 days, a technician whose first-time fix rate has dropped below 70%, or an asset whose repair frequency has doubled in six months. Sign Up Free to build a live maintenance dashboard that updates automatically as technicians complete work. Portfolios that implement structured dashboards reduce emergency repair spend by 30–50% within the first year because they catch deterioration early.
The 6 Essential Maintenance Dashboards Every Property Manager Needs
Not all dashboards serve the same audience or purpose. Executive dashboards summarize portfolio health for ownership. Operational dashboards drive daily technician dispatch. Cost dashboards support budget planning and variance analysis. The six dashboard types below cover every stakeholder and decision level in property management. Book a Demo to see how Oxmaint's pre-built dashboards are configured for each audience.
For ownership and regional directors. High-level portfolio health: total maintenance spend, cost per unit, cost per square foot, PM compliance %, emergency repair ratio, and year-over-year trend lines. Updates monthly. Goal: Prove ROI and justify budget requests.
For property managers and dispatchers. Real-time work order status: open by priority, aging by days, response time vs SLA, technician workload, and PM tasks due today. Updates continuously. Goal: Dispatch effectively and prevent SLA breaches.
For maintenance supervisors. Individual technician metrics: work orders completed, average completion time, first-time fix rate, overtime hours, and customer satisfaction rating. Updates weekly. Goal: Identify training needs and recognize high performers.
For property managers and finance. Financial metrics: total spend by property, by asset category, by month; budget variance; cost per work order; contractor vs in-house cost ratio; parts inventory value. Goal: Control costs and forecast accurately.
For property managers and legal. Service level metrics: response time by priority, completion time by priority, SLA breach rate by property, PM compliance by asset class, overdue PM aging, regulatory inspection status. Goal: Avoid fines and liability.
For maintenance supervisors and capital planners. Asset metrics: MTBF (mean time between failures), MTTR (mean time to repair), asset health score (0–100), repair frequency trend, remaining useful life estimate, and capital replacement forecast. Goal: Plan replacements, not emergencies.
Dashboard KPIs: What to Track on Every Dashboard
A dashboard without the right KPIs is just decoration. Every dashboard must answer specific questions for its audience. The table below shows which KPIs belong on which dashboard and what actions each metric should trigger. Sign Up Free to access Oxmaint's library of pre-built KPI widgets that populate automatically from your work order data.
| Dashboard | Primary KPIs | Target / Benchmark | Action Trigger |
|---|---|---|---|
| Executive | Cost per unit, PM compliance %, emergency repair ratio, budget variance | CPOR: $1.20–2.50; PM: >85%; Emergency: <20% | Variance >10% → review with property manager |
| Operational | Open work orders by priority, backlog aging, response time by priority | Open <10% monthly volume; aging <7 days; P1 response <15 min | Aging >10 days → escalate to supervisor |
| Technician | Work orders completed, first-time fix rate, overtime %, satisfaction rating | FTFR >75%; OT <5%; satisfaction >4.5/5 | FTFR <70% → coaching within 30 days |
| Cost | Total spend by property, budget variance, cost per work order | Variance ±5% monthly; CPWO trending flat or down | Variance >10% → investigate within 7 days |
| SLA/Compliance | SLA breach rate by property, PM compliance %, overdue PM aging | Breach <5%; PM >85%; aging <5% >30 days | PM aging >10% → add resources or reschedule |
| Asset Health | MTBF trend, MTTR trend, health score, replacement forecast | MTBF increasing; health score >80; forecast funded | Health score <60 → capital planning required |
Building Your Maintenance Dashboard: Step-by-Step Implementation
Property managers who build dashboards systematically see faster adoption and clearer insights. The four-phase process below moves from data foundation to actionable intelligence. Book a Demo to see how Oxmaint automates each phase with pre-built dashboard templates.
- Identify who needs visibility: ownership, regional managers, property managers, technicians
- For each audience, list 5 questions the dashboard must answer
- Example for ownership: "What is our cost per unit this month vs last year?"
- From the audience questions, derive specific KPIs with calculation formulas
- Set initial targets using industry benchmarks (provided in table above)
- Document baseline performance for each KPI before dashboard launch
- Place most important KPIs top-left (executive summary position)
- Use red/yellow/green status indicators for at-a-glance assessment
- Include trend lines (last 12 months) not just current snapshot
- Set dashboard refresh frequency (real-time for operational, daily for cost, monthly for executive)
- Schedule automated report distribution to stakeholders
- Train team on dashboard interpretation — what each KPI means and what action to take
Common Dashboard Design Mistakes and How to Avoid Them
Even well-intentioned dashboards fail when they prioritize data volume over decision velocity. The patterns below represent the most common dashboard failures in property management — and how to fix them. Sign Up Free to access Oxmaint's pre-designed dashboards that avoid these mistakes entirely.
Dashboard KPIs and Performance Metrics Reference
Property managers who track the right KPIs connect maintenance performance directly to financial outcomes and tenant satisfaction. Sign Up Free to access Oxmaint's automated KPI dashboard that calculates every metric below from your work order data.
Total maintenance operating spend ÷ total occupied room nights. Critical metric for ownership reporting and budget justification.
Time from work order creation to technician acknowledgment. Directly impacts tenant satisfaction scores.
Percentage of work orders resolved in a single visit. Below 70% indicates parts availability or training gaps.
Percentage of scheduled PM tasks completed on time. Below 70% predicts emergency repair increases within 6 months.
Labor hours spent on PM vs corrective repairs. Below 50% PM indicates reactive culture.
Weighted score based on age, repair frequency, parts availability, and efficiency. Any asset <60 requires replacement planning.