-justification-template.png)
Every major capital project at a U.S. steel plant — whether a $15 million tundish reline programme, an $80 million hot strip mill rebuilding, a $200 million EAF upgrade, or a $50 million environmental compliance retrofit — requires justification that connects the requested capital expenditure to measurable financial and operational returns that justify the deployment of company capital and constrained debt capacity over the multi-year payback period. Yet the majority of U.S. integrated mills and mini-mills still prepare CapEx justifications that separate the financial analysis from the operational narrative: a spreadsheet showing NPV and IRR calculations based on engineering estimates, running parallel to a maintenance engineer's narrative describing why the asset needs replacement. No connection exists. When the project scope expands (as every major project does), nobody updates the NPV calculation to reflect the new baseline cost. When the operational benefits — reduced downtime hours, improved energy efficiency, extended asset life, quality improvement — underperform the forecast, there is no structured mechanism to compare actual results against the business case that was approved. OxMaint's CapEx justification template connects the maintenance narrative, the lifecycle cost analysis, the NPV and IRR calculations, and the CMMS-backed tracking of actual project benefits into a single document structure that remains live throughout the asset's operating life — so every steel plant CapEx decision is made on consistent methodology, and every completed project leaves behind an auditable record of cost versus benefit that improves future forecasting accuracy and capital allocation discipline.
Steel Plant Capital Planning · CapEx Template
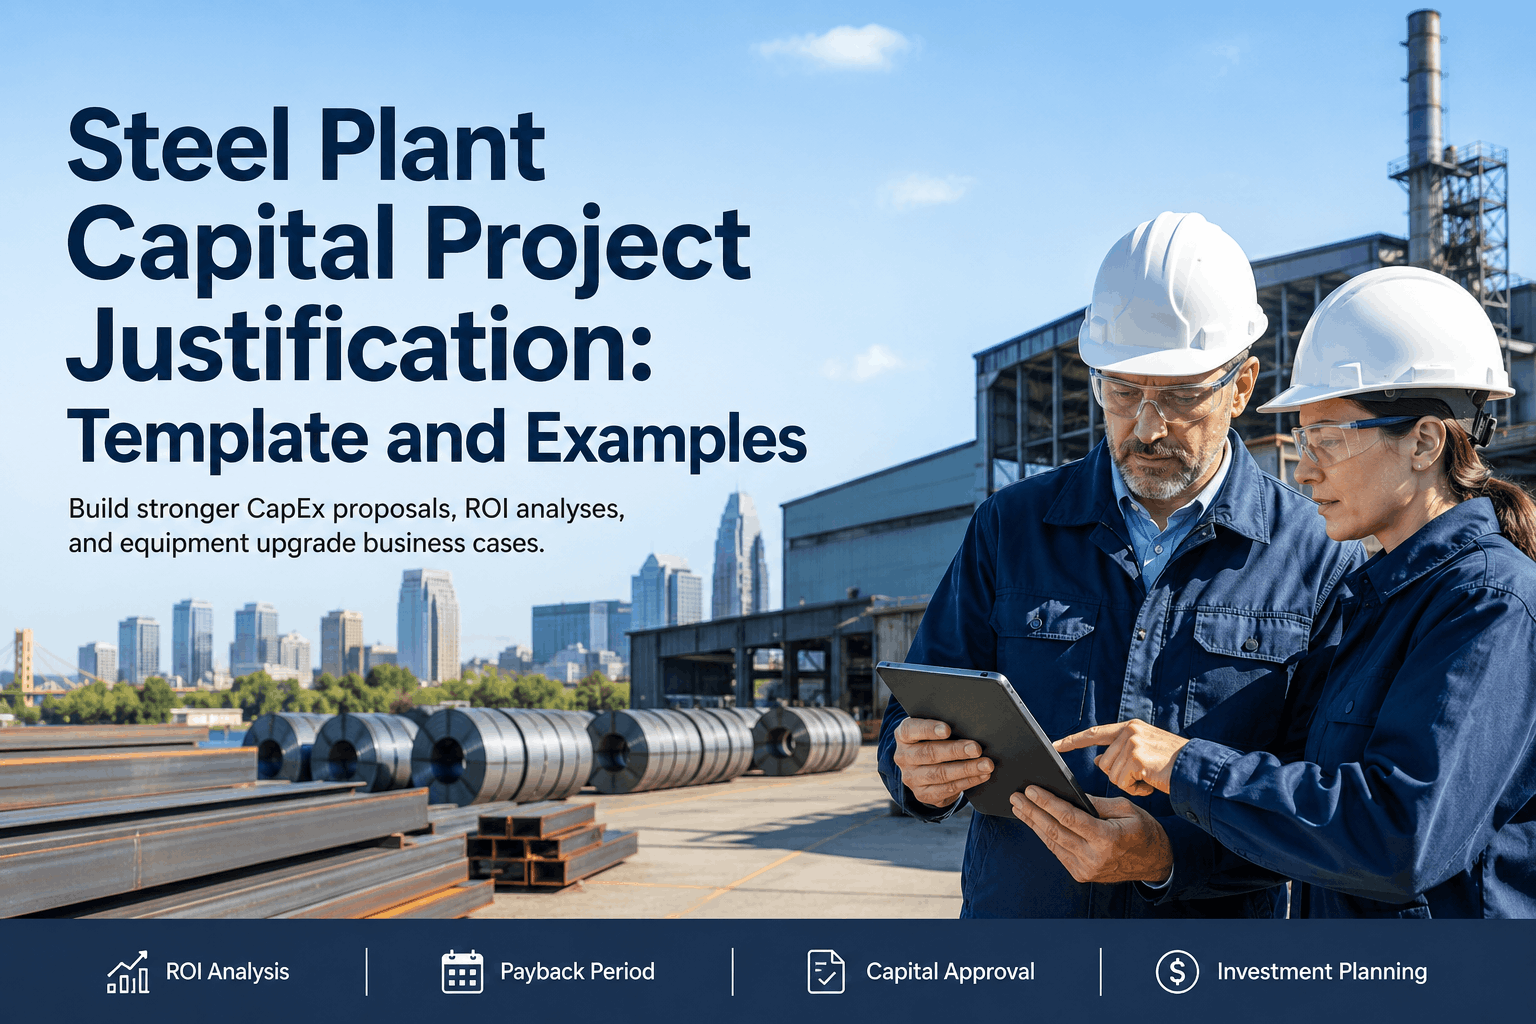
Steel Plant Capital Project (CapEx) Justification Template
Free Editable CapEx Template for Blast Furnace, BOF, Casting, Rolling Mills, and Environmental Systems — With NPV/IRR Calculations, RUL Analysis, and CMMS-Backed Outcome Tracking for U.S. Steel Operations
$15–200M
Typical capital project range for major steel plant asset replacements and upgrades
3–7 yrs
Typical payback period for major capital projects at U.S. integrated mills and mini-mills
6–12%
Target IRR for steel plant capital projects to justify risk and cost of capital deployment
40%
Of major steel plant capital projects exceed original cost estimate due to scope change or inflation
Why Steel Plant CapEx Justification Requires More Than Financial Spreadsheets
A $45 million hot strip mill work roll reline and bearing replacement CapEx justification spreadsheet shows NPV of $12M at 8% IRR based on three assumptions: reduction in unplanned downtime from 120 hours to 40 hours annually, energy efficiency improvement of 3% reducing fuel consumption per tonne of steel by $8/tonne, and extension of mill availability from 85% to 94% enabling $8M additional annual revenue. These three assumptions are the foundation of the entire business case. Yet in most U.S. steel plants, these assumptions have never been validated against historical data. Nobody has measured whether the previous mill rebuild actually achieved the downtime reduction claimed. Nobody knows whether the energy efficiency assumption is conservative, optimistic, or disconnected from reality. When the project encounters a 6-month installation delay (which happens in roughly 40% of major capital projects), nobody updates the NPV calculation to reflect the new timeline — so the spreadsheet continues to show a business case that is already obsolete.
The OxMaint CapEx justification template solves this problem by integrating five distinct document sections that must work together: the executive summary and project narrative describing the current asset condition and failure mode, the maintenance and operational impact assessment quantifying downtime hours, energy and material consumption, and quality metrics, the lifecycle cost analysis comparing do-nothing and reline-now scenarios out to asset end-of-life, the NPV and IRR calculations at multiple discount rates with sensitivity analysis on key assumptions, and the post-implementation outcome tracking section that records actual downtime, energy use, and revenue impact once the project goes live. This structure forces internal consistency: if the maintenance engineer says the project will reduce downtime by 80 hours annually, that assumption feeds directly into the NPV revenue calculation. If actual post-implementation downtime falls short of forecast, the variance is documented in the same template — creating an audit trail and a feedback loop that improves future CapEx forecasting.
Schedule a demo to see how OxMaint structures CapEx justification templates that remain live tracking tools throughout the asset lifecycle, not static spreadsheets that are archived the moment project approval is granted.
The Six Sections of OxMaint Steel Plant CapEx Justification Template
1
Project Narrative and Asset Condition Assessment
Current asset description, installed date, original design capacity, remaining useful life (RUL) estimate, failure mode classification, frequency of unplanned interventions, and reason for CapEx decision (imminent failure risk, efficiency improvement, regulatory requirement, capacity expansion). The narrative anchors the business case to a specific operational need rather than a generic replacement cycle.
2
Maintenance and Operational Impact Assessment
Quantified baseline operational metrics: current annual unplanned downtime hours, energy consumption per tonne produced or processed, product quality metrics (reheating furnace temperature uniformity variance, casting machine meniscus stability, rolling mill surface finish), scrap and rework rates. For the do-nothing scenario, projects these metrics forward to asset end-of-life based on historical deterioration rates. For the reline/upgrade scenario, estimates improvement trajectory post-installation with conservative assumptions.
3
Lifecycle Cost Analysis (LCA)
Compares total cost of ownership across the remaining asset life: do-nothing scenario includes escalating maintenance costs, repair material costs, unplanned downtime impact (lost production revenue), and eventual emergency replacement. The CapEx scenario includes initial capital expenditure, installation costs and downtime, ongoing maintenance and consumable costs post-upgrade, and salvage value at end-of-life. The LCA shows the break-even point where cumulative do-nothing cost exceeds cumulative CapEx cost.
4
NPV and IRR Financial Analysis
Calculates Net Present Value of the CapEx investment at corporate discount rate (typically 8–12% for major industrial projects) and Internal Rate of Return showing the percentage return on capital deployed. Includes sensitivity analysis: at what IRR does the project remain attractive if assumptions on downtime reduction or energy savings fall short by 10%, 20%, 30%? What happens if installation costs run 15% over budget? The sensitivity matrix shows project robustness across realistic variance scenarios.
5
Implementation Plan and Risk Register
Defines installation timeline (what portion requires shutdown vs. online execution), budget allocation by major equipment and labor categories, project risks (supply chain delays, skilled labor availability, vendor performance), mitigation strategies, and contingency reserve (typically 10–15% of capital budget for major projects). Links CapEx justification to a detailed project schedule with milestone dates and go/no-go decision points.
6
Post-Implementation Outcome Tracking
Once the capital project is complete, this section records actual operational metrics against the forecast: actual downtime hours achieved, energy consumption post-reline, quality improvements measured, and actual financial impact calculated. OxMaint automatically populates this section from CMMS maintenance records and operational data — so the variance between forecast and actual is documented in the same template that justified the original CapEx decision. Year-end variance analysis feeds into next year's CapEx forecast assumptions, closing the feedback loop.
Steel Plant CapEx Category Ranges: Typical Cost and Payback by Asset Class
Integrated Steel Plant CapEx Categories: Typical Investment Range and Payback Period
Blast Furnace Campaign Rebuild
$60–$120M
6–8 years
Includes refractory lining replacement, cooling systems upgrade, top gas recovery turbine; extended operational life 15+ additional years
BOF Steelmaking Upgrade
$40–$80M
4–6 years
Off-gas recovery system, refractory life extension, sublance and oxygen lance system modernization; improved yield and energy efficiency
Continuous Caster Reline / Upgrade
$30–$70M
3–5 years
Mould copper plate replacement, secondary cooling overhaul, straightener/withdrawal drive upgrade; reduces breakout risk, extends campaign life
Hot Strip Mill Rebuild (Work Rolls / Main Drive)
$45–$100M
4–6 years
Complete work roll system replacement, main reduction gearbox overhaul, AGC and thickness control modernization; improved productivity and product quality
Environmental Compliance (Baghouse / Scrubber / CEMS)
$15–$50M
Regulatory (not ROI-driven)
Required to maintain Title V permit and state environmental compliance; includes fenceline air monitoring per 2024 EPA NESHAP rule
EAF Mini-Mill Upgrade (Electrodes / Cooling)
$20–$60M
2–4 years
Electrode system modernization, scrap preparation equipment, improved cooling water recovery; directly improves melting efficiency and reduces energy cost per tonne
Our CapEx approval process was a disaster — spreadsheets from maintenance disconnected from finance spreadsheets, nobody tracking whether actual results matched the projection we used to justify the $58 million casting reline. After implementing OxMaint's template, our next CapEx justification for the hot strip mill rebuild used the actual outcome data from the previous project — adjusted our energy efficiency assumptions downward, which tightened the NPV but gave the executive committee confidence we were using real numbers, not wishes. The template also forced us to track post-implementation downtime in the CMMS from day one, so we don't have to scramble six months later trying to figure out if we actually saved the 80 hours of annual downtime we promised.
— Director of Capital Planning, Integrated Steel Plant, Great Lakes Region
FAQ — Steel Plant CapEx Justification Template for U.S. Steel Operations
What discount rate should U.S. steel plants use for NPV calculations in CapEx justification?
Typical U.S. integrated mills use 8–12% discount rates for NPV calculations depending on capital cost and project risk profile. The rate should equal or slightly exceed the company's weighted average cost of capital (WACC) plus a risk premium for project-specific uncertainties. For maintenance-driven replacements with low execution risk, 8–9% is appropriate; for growth or technology-change projects, 10–12% is more conservative.
How do OxMaint CapEx templates account for inflation and escalating maintenance costs during asset lifecycle?
OxMaint's lifecycle cost analysis allows you to configure annual inflation rates separately for capital costs, labor, energy, consumables (refractory, electrodes, spare parts), and utilities — modeling different escalation scenarios for each cost driver. The spreadsheet applies these rates to baseline costs and projects them forward across the asset's remaining useful life, showing how do-nothing maintenance costs grow vs. the fixed capital investment needed for a reline or rebuild.
Can the OxMaint CapEx template handle projects that extend over multiple fiscal years with phased spending?
Yes. OxMaint's CapEx template supports multi-year project timelines with phased spending profiles — for example, Year 1 engineering and procurement ($5M), Year 2 installation and commissioning ($35M), Year 3 completion and training ($8M). The NPV calculation discounts each year's cash flows separately, accurately reflecting the timing of capital deployment and the multi-year payback period.
How does OxMaint link CapEx justification forecast assumptions to actual CMMS maintenance data post-implementation?
OxMaint's post-implementation tracking section auto-populates with actual CMMS maintenance records — actual downtime hours from work orders, energy consumption from operational records, quality metrics from production logs — and calculates variance against the forecast assumptions used in the original CapEx justification. This automatic reconciliation creates an audit trail and improves future forecast accuracy.
Do U.S. steel plants need to model tax depreciation and deferred tax benefits in CapEx justifications?
Yes. For tax-sensitive valuations, OxMaint's extended CapEx template includes sections for depreciation schedules (straight-line or MACRS) and deferred tax asset recognition under U.S. tax code Section 168. This is particularly relevant for environmental compliance projects (5-year MACRS) vs. production equipment (7–15 year lives), which have different tax depreciation schedules. Consult your CFO or tax department on whether this detail is required for your company's capital approval process.
What happens to CapEx justifications if the project experiences cost overruns or timeline delays during execution?
OxMaint allows you to create project variance records within the CapEx template that document changes to total installed cost, installation duration, and expected in-service date. These changes automatically recalculate the NPV and IRR under the new timeline and cost baseline, showing the revised business case. This keeps the CapEx justification current throughout the project lifecycle rather than becoming obsolete on day one when the first scope change occurs.
Can the OxMaint CapEx template be used for both maintenance-driven replacements and strategic growth capital projects?
Yes. Maintenance-driven projects (tundish relining, bearing replacements, environmental retrofits) focus the business case on downtime reduction and lifecycle cost avoidance. Growth projects (additional caster strand, mill capacity upgrade, new product line equipment) emphasize incremental revenue and market expansion. OxMaint's template adapts to both scenarios with configurable assumption sections for either cost-avoidance or revenue-generation justifications.
Does the OxMaint CapEx template support comparative analysis of "do now" vs. "defer and do later" scenarios for capital projects?
Yes. OxMaint's scenario comparison feature allows you to model the financial impact of delaying a project — showing how escalating maintenance costs and lost production revenue during the deferral period affect the total cost of ownership and cumulative NPV. This helps capital committees make informed decisions about project timing and sequencing when capital is constrained across multiple competing projects.
OxMaint · Steel Plant CapEx Templates
Connect Your Steel Plant CapEx Justification to Live Project Tracking and Outcome Measurement
OxMaint's CapEx justification template moves capital project management from a static spreadsheet that gets archived at approval to a living document that tracks assumptions, costs, timelines, and actual benefits throughout the asset's operating life — improving forecast accuracy and creating institutional memory for future capital decisions.



.png)