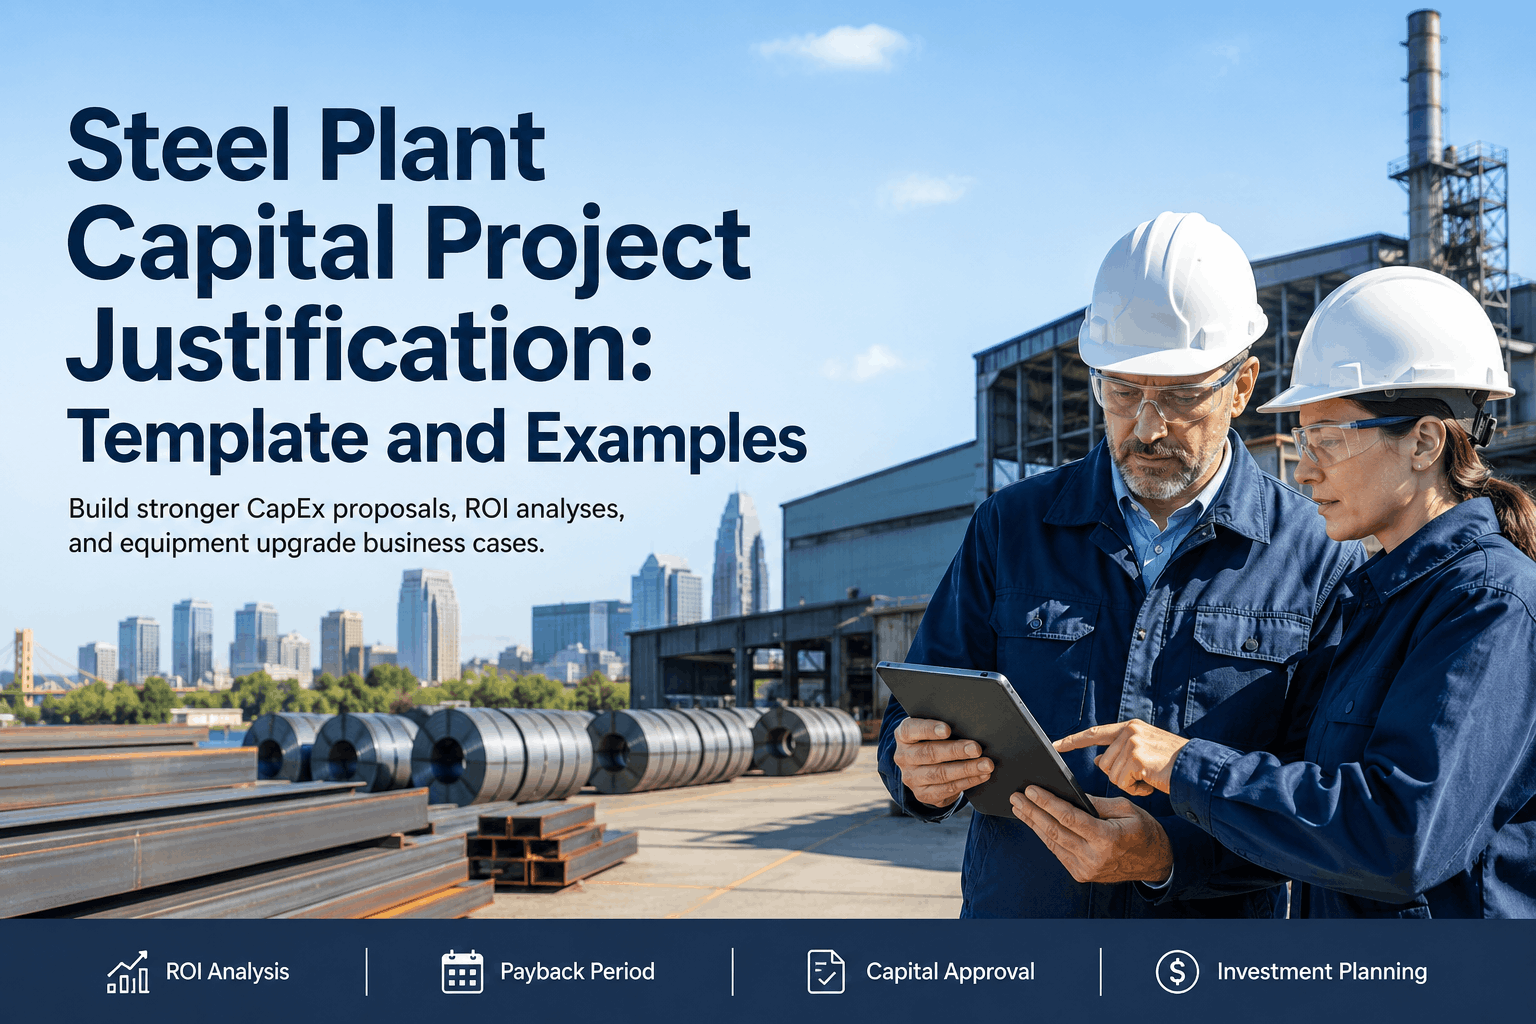
Steel Plant Capital Project Justification: Template and Examples
By Alex Jordan on June 19, 2026
A steel plant's blast furnace cooling system fails six times a year — each unplanned failure costs $240,000 in emergency contractor labor, expedited parts, and lost production during repair. Finance asks: "Why should we spend $2.1 million upgrading the cooling system?" The maintenance manager has no structured answer. They have failure records in a filing cabinet, spreadsheets from different years, and a vague sense that "this is costing us too much." Without a formal CapEx justification model, the cooling system stays broken. Instead of investing $2.1M to solve the problem, the plant accepts $1.4M in annual losses for five more years — and defers the real solution until equipment catastrophically fails. OxMaint structures capital investment decisions using 24 months of documented maintenance history, failure costs, asset condition data, and financial modeling. Every CapEx request is defensible: supported by actual maintenance records, ROI calculations, risk assessments, and payback period analysis. Start modeling your CapEx justifications or book a capital planning demo with our experts.
CapEx Planning · ROI Analysis · Equipment Investment Justification
Defend Every Equipment Investment with Data-Driven CapEx Justification
Build ROI models and financial cases for steel plant equipment upgrades. OxMaint structures CapEx justifications using maintenance history, failure costs, and asset condition data — giving finance the defensible business case they need to approve your capital projects.
average annual loss from unplanned equipment failures at mills that lack structured CapEx replacement justification and capital planning
48%
of proposed capital equipment investments fail to win approval because justification lacks documented ROI or defensible cost analysis
12–18M
typical payback period (months) for equipment upgrades that directly reduce emergency maintenance and production losses in steel plants
10–30%
target annual ROI benchmark for capital equipment investments in manufacturing — achievable with proper failure cost documentation
Finance Approval
The CapEx case that wins approval — ROI backed by 24 months of documented maintenance history. Instead of "we need a new cooling system," the business case shows: "This system failed 6 times last year at $240K per emergency repair = $1.44M annual loss. Upgrading to new system ($2.1M CapEx) will reduce failures to 0.5/year. Payback: 18 months. NPV over 5 years: $6.2M." OxMaint pulls failure history, cost data, and asset condition into a structured financial model that gives finance confidence to approve the investment.
The CapEx Justification Framework: From Failure Data to Financial Decision
Establish Current Failure Cost Baseline (24-Month History)
Document every failure of the equipment under consideration: downtime minutes, emergency labor costs, expedited parts premiums, lost production value. A bearing that fails twice annually @ $85K each = $170K annual loss. Add the "hidden" costs: rework of product, customer delays, safety investigation time. Real failure costs typically exceed direct labor and parts by 30–50%. OxMaint extracts this data directly from 24 months of work order history, making the baseline rigorous and defensible.
Define Target Equipment and Upgrade Scope
Specify exactly what is being replaced: old cooling system → new modular unit with redundant pumps and automated temperature control. Get vendor quotes for CapEx cost, installation labor, and training. Define expected lifespan (15 years) and residual value. Scope creep kills CapEx approval — keep the justification focused on this one investment decision. Link the scope to the specific failure modes you documented in the baseline step.
Quantify Expected Failure Reduction and Avoidance Benefits
New equipment: what failure rate does the vendor guarantee? Industry data: modern cooling systems achieve 95% uptime vs legacy 60% uptime. Use the lowest reasonable estimate — don't inflate benefits. If old system failed 6 times/year, assume new system fails 0.5 times/year (10% baseline for unexpected issues). This conservative estimate gives finance confidence the ROI is achievable, not theoretical.
Old system annual failures: 6 × $240K = $1.44M. New system annual failures: 0.5 × $240K = $120K. Avoided annual failure cost: $1.32M. Add secondary benefits: newer equipment requires less emergency labor (trained staff, parts readily available) = 8% labor cost reduction. Higher efficiency (40% vs 55% energy consumption) = $180K annual energy savings. Total annual benefit: $1.56M. Conservative, documented, and aligned with historical costs.
Model Financial Metrics: ROI, Payback, NPV
CapEx: $2.1M. Annual savings: $1.56M. Simple payback period: 16 months. Annual ROI: $1.56M / $2.1M = 74% in year one, declining as equipment ages but remaining positive. Net Present Value over 5 years at 8% discount: $4.1M. These metrics tell the finance story: rapid payback, strong ROI, and positive long-term value. OxMaint models scenarios (What if failures reduce 60% instead of 80%?) so you show confidence ranges, not point estimates.
Assess Risk and Contingency: Execution Risk, Performance Risk, Market Risk
What could go wrong? Installation delays (push payback to 20 months). New equipment underperforms (achieve 70% failure reduction instead of 80%, reducing NPV by $900K). Supply chain disruption for replacement parts (factor 15% cost escalation). Quantify each risk and its probability, then model worst-case scenario. Finance respects risk-aware justifications more than overly optimistic ones. Contingency reserve (10–15% of CapEx) demonstrates mature planning.
CapEx Approval Workflow: From Business Case to Implementation
Capital Planning Cycle · Financial Approval · Performance Tracking
Step 1 · Document
Maintenance History
Extract 24 months of work order data for equipment being considered for replacement. Quantify failure frequency, costs, and production impact. Create baseline that justifies the investment decision.
→
Step 2 · Model
Financial Case
Calculate ROI, payback period, and NPV using conservative failure reduction estimates. Model risk scenarios. Build financial justification that addresses finance team questions before they ask them.
→
Step 3 · Execute
Track & Validate
Post-implementation, track actual failure rates, cost reductions, and ROI realization. Document performance against justification. Build credibility for future CapEx proposals by proving out the current investment.
Steel Plant CapEx Justification · ROI Modeling · Capital Investment
From Failure Cost Data to Finance Approval
OxMaint builds defensible CapEx justifications using 24 months of documented maintenance history, failure costs, and risk assessment. Finance sees data, not pleas. Approvals accelerate. Capital decisions improve. Start free in 48 hours.
CapEx Case Studies: Real Steel Plant Equipment Investments with ROI Results
Equipment Investment
CapEx Cost
Annual Benefit
Payback Period
5-Year NPV
Blast Furnace Cooling System Upgrade
$2.1M
$1.56M
16 months
$4.1M
Rolling Mill Bearing Cartridge Replacement
$480K
$342K
17 months
$1.2M
Steam Trap Automation & FDD System
$340K
$480K
9 months
$1.8M
Continuous Casting Strand Upgrade
$1.8M
$890K
24 months
$2.3M
Crane Hoist Motor Replacement Program
$760K
$510K
18 months
$1.6M
Automated Failure Cost Extraction from 24-Month Work Order History
OxMaint queries your CMMS work order database for all failures of a specific equipment type over 24 months. Labor costs, parts costs, duration, production loss value — all extracted and aggregated. The baseline cost analysis is built from real maintenance data, not estimates. Finance trusts the numbers because they're traceable to actual work order records.
ROI Calculation Engine with Conservative Benefit Modeling
Input CapEx cost, expected failure reduction (as a percentage), and benefit categories (avoided failure cost, energy savings, labor reduction). OxMaint calculates ROI, payback period, and NPV automatically. Conservative default assumptions (80% of vendor-promised failure reduction) show finance you're not inflating benefits. Scenario modeling (60%, 70%, 80% reduction) demonstrates you've thought through risk.
Risk Assessment and Contingency Planning for Capital Projects
OxMaint helps you quantify execution risk (installation delays = 15% cost overrun), performance risk (new equipment underperforms = 20% reduction in expected benefit), and market risk (supply chain disruption adds 12% to part costs). Sensitivity analysis shows how each risk factor impacts payback period and ROI. Finance sees you've thought through what could go wrong.
Post-Implementation Performance Tracking and ROI Validation
After the new equipment is installed, OxMaint tracks actual failure rates, cost reductions, and energy consumption against the business case projection. Monthly reports show "Projected annual benefit: $1.56M. Actual annualized benefit at month-6: $1.48M. On track to achieve 95% of justified benefit." This real performance data builds credibility for your next CapEx proposal and proves investment discipline to finance leadership.
Multi-Year Capital Plan Prioritization Across Equipment Categories
If you have five equipment upgrade opportunities ($1.2M blast furnace, $800K rolling mill, $600K conveyor), which do you prioritize? OxMaint ranks them by ROI, payback period, risk score, and strategic alignment. If you have $2M annual CapEx budget, the analysis tells you which combination of investments maximizes total return. Financial steering becomes data-driven instead of political.
ERP Integration for Finance Approval Workflows and Budget Tracking
Once a CapEx is approved, OxMaint syncs to SAP, Oracle, or NetSuite for capital project tracking. As invoices arrive from vendors and contractors, costs flow into the project accounting system automatically. Finance sees actual spend against approved CapEx budget in real time, improving capital project financial control and reducing month-end reconciliation work.
CapEx Justification Template: Key Components of a Winning Business Case
24 Mo
of failure data and cost history required to build credible baseline for CapEx business case — typical documentation window for equipment performance
16–20 Mo
average payback period for equipment upgrade CapEx in steel plants — range that finance finds acceptable for risk approval
$2.8M
average 5-year NPV improvement for equipment replacement projects when baseline failure costs and avoidance benefits are properly documented
"We proposed upgrading the cooling system three times over five years and got rejected every time. The fourth time, we brought actual failure data from CMMS: 6 failures, $240K each, $1.44M total annual cost. Then we showed: $2.1M investment, 18-month payback. Finance approved the next day. The difference wasn't the equipment — it was the defensible data. OxMaint gave us the business case that worked."
— Capital Planning Manager, Integrated Steel Mill, USA
CapEx Justification FAQ: Finance Questions and Documentation Answers
What is a reasonable ROI target for steel plant equipment upgrades?
Industry benchmark is 10–30% annual ROI for capital equipment investments. Equipment that eliminates unplanned failures (cooling systems, bearing assemblies) typically achieves 50–80% ROI in year one, declining as benefits stabilize in years 2–5. Seek projects with payback periods of 18–24 months maximum.
How do we calculate the cost of downtime to justify emergency vs planned upgrades?
Standard formula: (Lost production tonnage × Revenue per ton) + (Emergency labor premium × Hours) + (Expedited parts cost premium) + (Customer penalty/loss). Example: blast furnace outage = 600 tons lost × $220/ton = $132K production loss alone. Unplanned failure costs 50–300% more than planned upgrade.
Should we include secondary benefits like energy savings or labor reduction in ROI calculation?
Yes, but be conservative. If new equipment is 40% more efficient, calculate actual energy reduction from historical consumption data. If labor requirement drops from 8 hours to 6 hours per maintenance cycle, use that documented figure. Finance prefers conservative ROI models with multiple benefit categories over inflated single-benefit cases.
How do we justify equipment replacement when the old equipment is still producing?
Quantify the cost of continued operation: failure frequency, maintenance labor, parts expense, and production losses over the equipment's remaining life. If continuing the old system costs $600K annually for 5 years ($3M total), and the new system costs $2.1M upfront with $80K annual maintenance, the upgrade saves $2.4M over the period. This forces the economic comparison: defer vs invest.
What happens to ROI if the new equipment doesn't perform as expected?
Model worst-case scenarios: If new equipment achieves 60% of promised failure reduction instead of 80%, annual benefits drop from $1.56M to $1.04M, extending payback from 16 to 24 months. Finance appreciates risk-aware models showing you've considered underperformance. Include performance guarantees from vendors in the contract.
How long should we maintain failure data history before proposing CapEx?
24 months minimum. This window captures seasonal variations, multiple failure cycles, and pricing volatility. Shorter windows (3–6 months) show insufficient data for pattern validation. Longer windows (36+ months) can dilute current performance if equipment condition has recently degraded.
Can we get CapEx approval faster if we demonstrate how OxMaint will help track performance post-implementation?
Absolutely. Finance gains confidence when you commit to post-implementation ROI verification. "We will track actual failure rates, maintenance costs, and energy consumption monthly against the business case projection and report quarterly to leadership." This performance tracking commitment often accelerates CapEx approvals.
Should we include contingency reserves in the CapEx budget, and how much?
Yes. Allocate 10–15% of equipment CapEx cost as contingency for installation overruns, scope changes, or training requirements. A $2.1M cooling system upgrade should budget $2.31M–$2.42M total with contingency. This demonstrates realistic planning and avoids mid-project budget explosions that damage credibility.
Finance says "no" because maintenance can't prove the case with data.
OxMaint turns 24 months of maintenance history into a defensible ROI model. Every CapEx request shows ROI, payback period, and risk assessment. Finance says "yes" because the investment is backed by evidence, not hope.
Win CapEx Approval with Data-Backed Business Cases
Extract failure costs from 24 months of maintenance history. Build ROI models with conservative benefit assumptions. Model risk scenarios. Get CapEx approved faster because finance sees defensible numbers, not maintenance pleas. OxMaint turns your maintenance data into capital planning arguments that finance leaders understand and approve. Start free in 48 hours.

-justification-template.png)
.png)