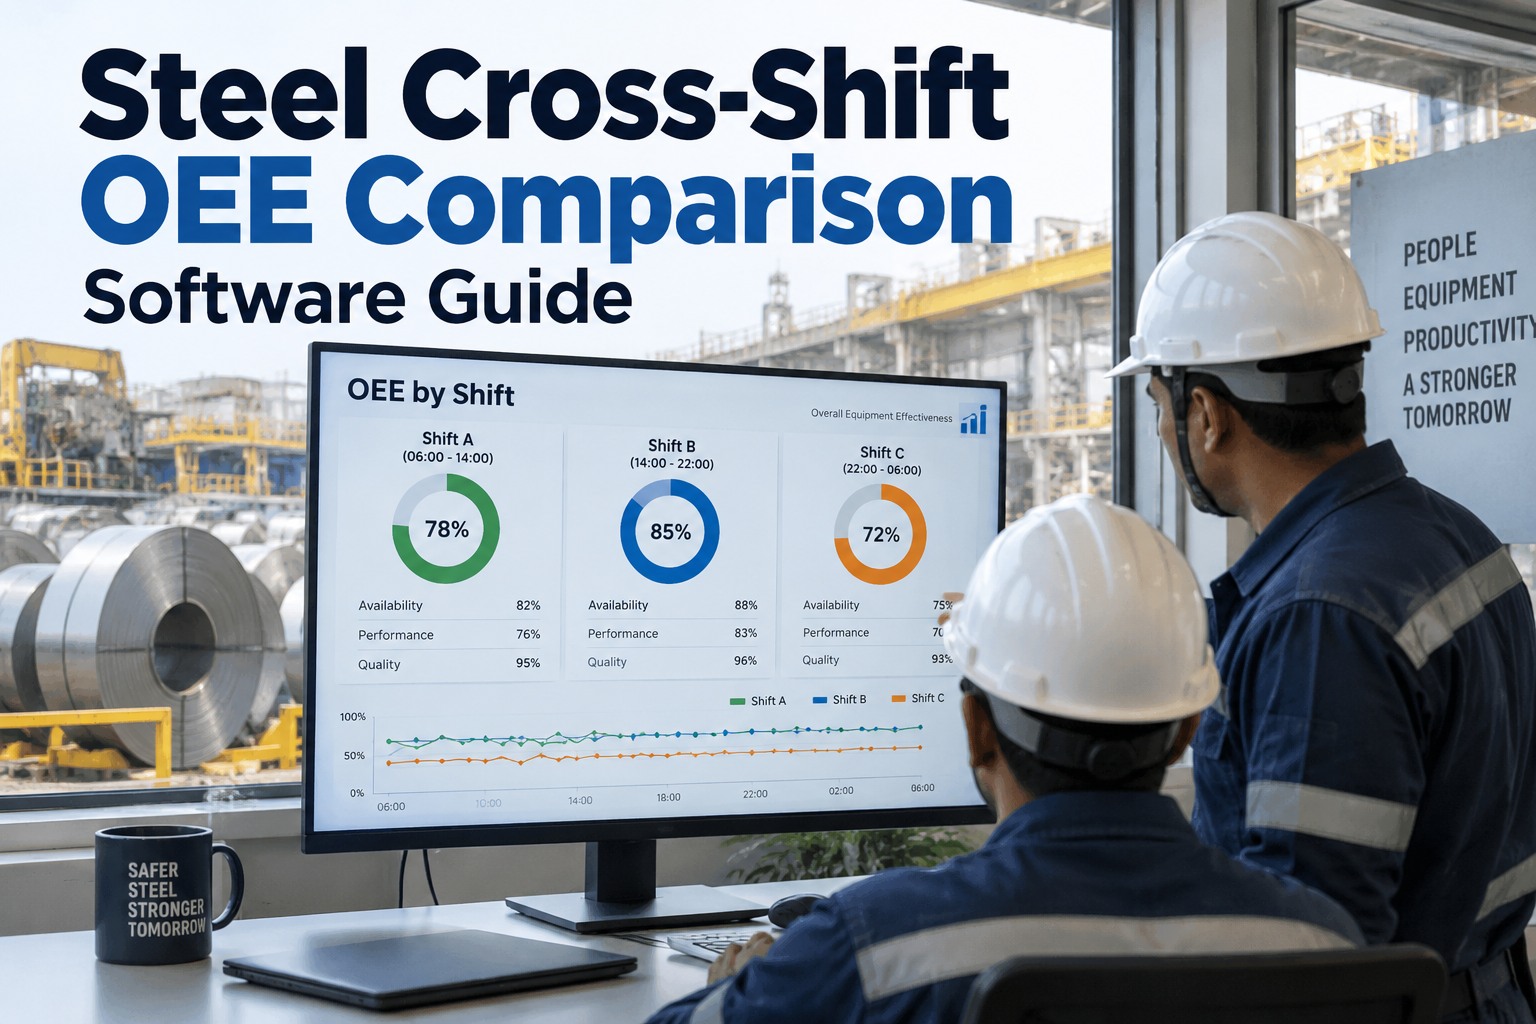
steel-cross-shift-oee-comparison-software-guide

Steel Cross-Shift OEE Comparison Software Guide


Your steel plant OEE report says 62%. That single number is a lie of averaging  because Shift A ran 71%, Shift B ran 64%, and Shift C ran 51% on the exact same caster, mill, and furnace. Same equipment, same grade, three wildly different outcomes. The 20-point gap between your best and worst shift is almost entirely operational, and it is the cheapest capacity in your plant to recover — no capital, no new machines. Cross-shift OEE comparison software is the discipline that surfaces that gap and turns supervisor coaching into a data-driven habit instead of a hunch. This guide covers the 2026 method and how OxMaint's maintenance management software carries it. Start free or book a demo.

Steel · OEE · Cross-Shift Comparison · CMMS 2026

Steel Cross-Shift OEE Comparison Software Guide

Compare A vs B vs C shift on the same asset — and you find the 15–20 points of hidden capacity that a monthly average buries. This is the cross-shift discipline that makes coaching a number, not an opinion.

20 pts
typical spread between best and worst shift on identical equipment
52–58%
OEE the average steel plant runs; world-class hits 78–85%
10–30%
of shift time lost to microstops operators rarely log
$15–45M
annual production value trapped in the OEE gap at a typical integrated mill

The Monthly Average Is Where Improvement Goes to Hide

A plant-level OEE of 62% feels like one problem to solve. It isn't. It's the blend of three shifts running the same line to three different standards — and the moment you average them, the signal that would tell you which shift and why disappears. You can't coach an average. You coach the gap between Shift A's 71% and Shift C's 51%, because that gap is a controllable difference in handover, response speed, and technique — not a difference in the steel or the machine. Sign up free and OxMaint calculates OEE per shift, per line, per asset automatically, so the number you act on is the one that actually points somewhere.

What the monthly report shows
Plant OEE · 62%
One number. No direction. Nothing to act on.
split by shift ↓
Shift A
71%
Best practice — the internal benchmark
Shift B
64%
Middle — closable with the A playbook
Shift C
51%
The 20-pt gap — where the capacity lives

Decompose the Gap: A, P and Q Fail Differently by Shift

"Shift C is worse" is not actionable. "Shift C loses 9 points to availability from slow breakdown response, while Shift A loses its points to speed" is. Cross-shift comparison only earns its keep when it splits each shift's OEE into Availability, Performance and Quality — because two shifts can post the same OEE for completely opposite reasons, needing opposite fixes. Book a demo to see the A×P×Q breakdown side by side for your lines.

Factor
Shift A
Shift B
Shift C
What the gap says
Availability
94%
90%
82%
C responds slowly to stops — a coaching + handover fix
Performance
83%
79%
72%
C bleeds microstops & runs below rate — technique gap
Quality
91%
90%
86%
Roughly even — quality isn't C's problem
OEE
71%
64%
51%
Same asset · the whole gap is Availability + Performance

Why One Shift Beats Another on the Same Machine

When identical equipment posts a 20-point spread, the cause is never the equipment. It's the handful of operational habits that change with the crew — and every one of them is coachable. These are the levers cross-shift data keeps pointing back to. Sign up free to track them per shift.

01
The Handover
The 10–15 minute window that decides the next 8 hours. A skipped handover means the incoming crew rediscovers issues and burns the first hour — one shift's worth of preventable loss, every day.
02
Breakdown Response Speed
The same trip costs 4 minutes on one shift and 22 on another. Response time is pure availability, and it's the single loudest driver of the A-vs-C gap.
03
Microstop Tolerance
30-second jams and sensor trips that never get logged add up to 10–30% of shift time. Some crews clear and prevent them; some let them ride. That's pure performance loss.
04
Changeover Technique
Roll changes, grade transitions and tundish swaps vary widely by crew. The best shift's changeover time is the SMED benchmark every other shift should be measured against.

You Can't Coach a Number You Don't Trust.

The reason cross-shift coaching fails isn't bad supervisors — it's that "downtime" on Shift A means something different than on Shift C, so the comparison is noise. OxMaint captures every stop with a standard cause code, duration and equipment tag automatically, giving every shift the same definitions and the same scoreboard.

The Cross-Shift Comparison Loop

Comparing shifts once produces a chart. Comparing them on a repeating loop produces improvement — because the gap only closes when the best shift's method becomes the standard and every shift is measured against it the next day. Here's the five-step discipline OxMaint runs. Book a demo to see it on your floor.

1
Capture Every Loss, Same Definitions
Operators log stops with standard cause codes; OEE calculates per shift automatically. No definition drift between crews.
2
Compare A vs B vs C on the Same Asset
Line up the three shifts' A×P×Q on identical equipment and grade. The gap and its root factor become obvious.
3
Set the Internal Benchmark
The best shift's number becomes the target — a real, achieved-on-this-machine benchmark, not a vendor spec nobody believes.
4
Coach to the Specific Loss
Hand supervisors the exact loss category, not a vague "do better" — response speed for C, changeover for B, wherever the data points.
5
Re-Measure Next Shift & Track the Trend
Daily display, weekly trend, monthly report. The gap narrows and stays narrowed because the scoreboard never goes dark.

Spreadsheet Shift Tracking vs. Cross-Shift OEE in OxMaint

Most plants attempt cross-shift comparison in Excel, and it quietly fails for the same three reasons every time: microstops vanish, data arrives days late, and definitions drift between crews so the comparison is unreliable. Here's what changes when the comparison lives in a CMMS built for it. Start free and put one line on a real scoreboard this week.

Element
Spreadsheet Shift Tracking
Cross-Shift OEE in OxMaint
Downtime definitions
Drift between crews — comparison is noise
Standard cause codes, identical for every shift
Microstops
Rarely logged — 10–30% of loss invisible
Captured automatically with duration & tag
Data timing
Arrives 3–5 days late, root cause buried
Shift-end OEE calculated live, per line
A vs B vs C view
Manual, error-prone, seldom rebuilt
Side-by-side A×P×Q the moment a shift ends
Benchmark
Vendor spec nobody on the floor believes
Best shift's real achieved number on that asset
Coaching input
"Do better" — no specific loss to target
Exact loss category ranked by cost impact

What OxMaint Gives Operations & Shift Supervisors

OxMaint connects every logged stop to the OEE number and every OEE gap to a coachable loss — so operations sees where capacity is trapped and supervisors get a scoreboard their crews trust. Here's the concrete mapping. Book a demo to see it on your lines.

Automatic Per-Shift OEE
Availability, Performance and Quality calculated per shift, per line, per asset — no manual spreadsheet assembly, no lag.
Standard Cause Codes
One downtime taxonomy across every crew, so a stop means the same thing on Shift A and Shift C — the prerequisite for any real comparison.
A vs B vs C Comparison View
Side-by-side shift OEE with the A×P×Q split, surfacing the gap and its dominant loss factor automatically.
Microstop Capture
The sub-5-minute stoppages spreadsheets miss — logged with duration and equipment tag so performance loss stops hiding.
Digital Shift Handover
OEE state, open work orders and active issues transfer automatically, freeing the human conversation for context data can't carry.
Loss-Ranked Coaching Feed
Top losses per shift ranked by cost impact, turning supervisor coaching from opinion into a targeted, evidence-based conversation.

Use this cross-shift method plus OxMaint to close the gap between your best and worst shift, turn your top crew's technique into the plant standard, and recover the capacity that's already sitting inside your existing lines. Try OxMaint free or book a demo to see it on your steel plant.

"

Our monthly OEE sat at 60% for two years and nobody could move it, because 60% was the answer to the wrong question. When we split it by shift in OxMaint, one crew was at 70% and another at 50% on the same caster — and the whole gap was breakdown response time and unlogged microstops, not the machine. We made the best shift's handover the standard and coached the others to their specific losses. Within a quarter the worst shift closed half the gap. We added measurable capacity without spending a rupee on equipment. The scoreboard did what two years of meetings couldn't.

Operations Manager · Integrated Steel Plant

Frequently Asked Questions

Why compare OEE across shifts instead of just tracking plant OEE?
Because a plant average blends three different shift performances into one number you can't act on. Same equipment often shows a 20-point spread between shifts — a controllable, operational gap that the average hides completely.
If it's the same machine, why do shifts get different OEE?
The equipment is constant; the habits aren't. Handover quality, breakdown response speed, microstop tolerance and changeover technique all change with the crew — and every one of them is coachable.
Why does spreadsheet-based shift comparison usually fail?
Microstops go unlogged, data arrives days late, and "downtime" drifts to mean different things on different shifts. Without shared definitions and automatic capture, the comparison is just noise.
How does OxMaint make cross-shift comparison reliable?
It captures every stop with a standard cause code, duration and equipment tag automatically, then calculates OEE per shift and lines up A vs B vs C with the A×P×Q split — one scoreboard, one set of definitions.
What capacity can closing the shift gap actually recover?
Most steel plants find 10–15 points of improvement in the first diagnostic — capacity already sitting inside existing lines. At a typical integrated mill that's worth millions annually, with no new equipment. Sign up free to start.

Stop Averaging Away Your Best Capacity.

OxMaint calculates OEE per shift, captures every loss with the same definitions across every crew, and lines up A vs B vs C so the gap — and the coaching that closes it — is a number, not an argument. Start free — no credit card, unlimited users, forever. Or book a demo.

Share This Story, Choose Your Platform!